
Page 127 - Six Sigma Demystified
P. 127
108 Six SigMa DemystifieD
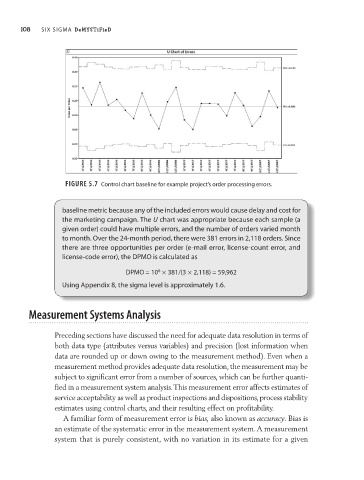
Figure 5.7 Control chart baseline for example project’s order processing errors.
baseline metric because any of the included errors would cause delay and cost for
the marketing campaign. The U chart was appropriate because each sample (a
given order) could have multiple errors, and the number of orders varied month
to month. Over the 24-month period, there were 381 errors in 2,118 orders. Since
there are three opportunities per order (e- mail error, license- count error, and
license- code error), the DPMO is calculated as
6
DPMO = 10 × 381/(3 × 2,118) = 59,962
Using appendix 8, the sigma level is approximately 1.6.
Measurement Systems analysis
Preceding sections have discussed the need for adequate data resolution in terms of
both data type (attributes versus variables) and precision (lost information when
data are rounded up or down owing to the measurement method). Even when a
measurement method provides adequate data resolution, the measurement may be
subject to significant error from a number of sources, which can be further quanti-
fied in a measurement system analysis. This measurement error affects estimates of
service acceptability as well as product inspections and dispositions, process stability
estimates using control charts, and their resulting effect on profitability.
A familiar form of measurement error is bias, also known as accuracy. Bias is
an estimate of the systematic error in the measurement system. A measurement
system that is purely consistent, with no variation in its estimate for a given