
Page 125 - Six Sigma Demystified
P. 125
106 Six SigMa DemystifieD
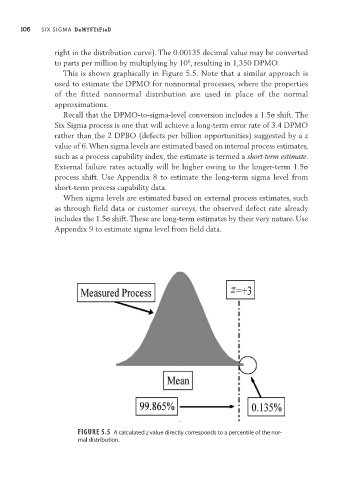
right in the distribution curve). The 0.00135 decimal value may be converted
6
to parts per million by multiplying by 10 , resulting in 1,350 DPMO.
This is shown graphically in Figure 5.5. Note that a similar approach is
used to estimate the DPMO for nonnormal processes, where the properties
of the fitted nonnormal distribution are used in place of the normal
approximations.
Recall that the DPMO- to- sigma- level conversion includes a 1.5s shift. The
Six Sigma process is one that will achieve a long- term error rate of 3.4 DPMO
rather than the 2 DPBO (defects per billion opportunities) suggested by a z
value of 6. When sigma levels are estimated based on internal process estimates,
such as a process capability index, the estimate is termed a short- term estimate.
External failure rates actually will be higher owing to the onger- term 1.5s
l
process shift. Use Appendix 8 to estimate the ong- term sigma level from
l
short- term process capability data.
When sigma levels are estimated based on external process estimates, such
as through field data or customer surveys, the observed defect rate already
includes the 1.5s shift. These are long- term estimates by their very nature. Use
Appendix 9 to estimate sigma level from field data.
Figure 5.5 a calculated z value directly corresponds to a percentile of the nor-
mal distribution.