
Page 148 - Six Sigma Demystified
P. 148
Chapter 6 a n a ly z e S tag e 129
assumptions cannot be met. A nonparametric test is one in which there are no
distributional requirements, such as normality, for the validity of the test. Typi-
cally, nonparametric tests require larger sample sizes than parametric tests.
When there are more than two populations to compare, general analysis of
variance (ANOVA) techniques are applied. ANOVA provides a means of com-
paring the variation within each subset (or treatment) of data to the variation
between the different subsets of data. The between- subset variation is a reflec-
tion of the possible differences between the subset averages. The within- subset
variation, for each subset, is a reflection of the inherent variation observed
when sampling from the subset repeatedly.
The null hypothesis tested by ANOVA is that all the subset averages are
equal. The F statistic is used to compare the mean square treatment (the aver-
age between subset variation) with the mean square error (the sum of squares
of the residuals). The assumptions in the test are that the distribution for each
subset is normal and that the subsets have equal variance (although their means
may be different). The null hypothesis that the subset means are equal is
rejected when the p value for the F test is less than 0.05, implying that at least
one of the subset averages is different.
The techniques described in this section provide a means of determining
statistical differences between sets of observed data. The results of these types
of analysis are interesting yet not compelling. The observational data used in
the analysis may be biased owing to the manner in which they were collected
or confounded (coincident) with other factors that were not measured or
recorded during data collection. These confounding factors, rather than the fac-
tor under investigation, which appears significant, may be the underlying cause
for the statistical difference.
As a result, the findings from these analyses should serve as input to more
rigorous techniques for understanding causal relationships— specifically
designed experiments.
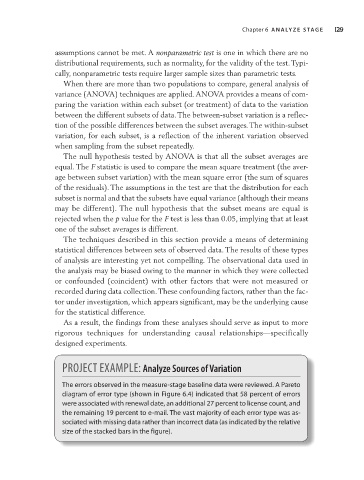
PRojeCt exAmPle: AnalyzeSourcesofVariation
The errors observed in the measure- stage baseline data were reviewed. a Pareto
diagram of error type (shown in Figure 6.4) indicated that 58 percent of errors
were associated with renewal date, an additional 27 percent to license count, and
the remaining 19 percent to e- mail. The vast majority of each error type was as-
sociated with missing data rather than incorrect data (as indicated by the relative
size of the stacked bars in the figure).