
Page 147 - Six Sigma Demystified
P. 147
128 Six SigMa DemystifieD
differences between the null and alternative means make it easier to detect the
differences statistically. Smaller population sigma or larger sample sizes cause the
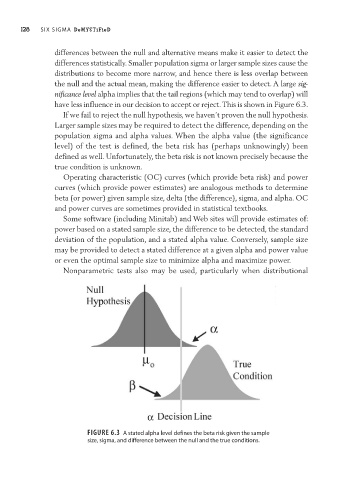
distributions to become more narrow, and hence there is less overlap between
the null and the actual mean, making the difference easier to detect. A large sig-
nificance level alpha implies that the tail regions (which may tend to overlap) will
have less influence in our decision to accept or reject. This is shown in Figure 6.3.
If we fail to reject the null hypothesis, we haven’t proven the null hypothesis.
Larger sample sizes may be required to detect the difference, depending on the
population sigma and alpha values. When the alpha value (the significance
level) of the test is defined, the beta risk has (perhaps unknowingly) been
defined as well. Unfortunately, the beta risk is not known precisely because the
true condition is unknown.
Operating characteristic (OC) curves (which provide beta risk) and power
curves (which provide power estimates) are analogous methods to determine
beta (or power) given sample size, delta (the difference), sigma, and alpha. OC
and power curves are sometimes provided in statistical textbooks.
Some software (including Minitab) and Web sites will provide estimates of:
power based on a stated sample size, the difference to be detected, the standard
deviation of the population, and a stated alpha value. Conversely, sample size
may be provided to detect a stated difference at a given alpha and power value
or even the optimal sample size to minimize alpha and maximize power.
Nonparametric tests also may be used, particularly when distributional
Figure6.3 a stated alpha level defines the beta risk given the sample
size, sigma, and difference between the null and the true conditions.