
Page 149 - Six Sigma Demystified
P. 149
130 Six SigMa DemystifieD
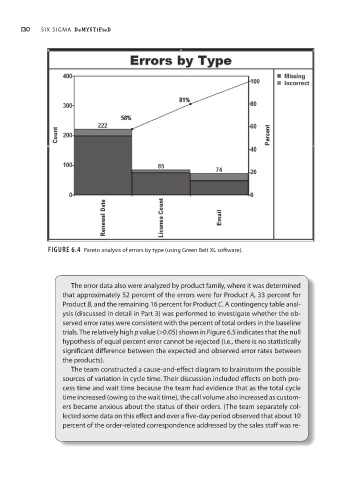
Figure6.4 Pareto analysis of errors by type (using green Belt xL software).
The error data also were analyzed by product family, where it was determined
that approximately 52 percent of the errors were for Product A, 33 percent for
Product B, and the remaining 16 percent for Product C. a contingency table anal-
ysis (discussed in detail in Part 3) was performed to investigate whether the ob-
served error rates were consistent with the percent of total orders in the baseline
trials. The relatively high p value (>0.05) shown in Figure 6.5 indicates that the null
hypothesis of equal percent error cannot be rejected (i.e., there is no statistically
significant difference between the expected and observed error rates between
the products).
The team constructed a cause- and- effect diagram to brainstorm the possible
sources of variation in cycle time. Their discussion included effects on both pro-
cess time and wait time because the team had evidence that as the total cycle
time increased (owing to the wait time), the call volume also increased as custom-
ers became anxious about the status of their orders. (The team separately col-
lected some data on this effect and over a five- day period observed that about 10
percent of the order- related correspondence addressed by the sales staff was re-