
Page 157 - Six Sigma Demystified
P. 157
138 Six SigMa DemystifieD
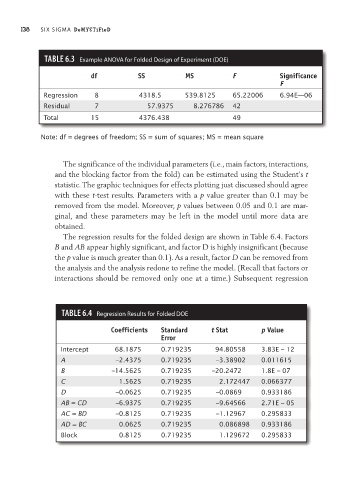
TAble6.3 Example aNOVa for Folded Design of Experiment (DOE)
df SS MS F Significance
F
Regression 8 4318.5 539.8125 65.22006 6.94E—06
Residual 7 57.9375 8.276786 42
Total 15 4376.438 49
Note: df = degrees of freedom; SS = sum of squares; mS = mean square
The significance of the individual parameters (i.e., main factors, interactions,
and the blocking factor from the fold) can be estimated using the Student’s t
statistic. The graphic techniques for effects plotting just discussed should agree
with these t- test results. Parameters with a p value greater than 0.1 may be
removed from the model. Moreover, p values between 0.05 and 0.1 are mar-
ginal, and these parameters may be left in the model until more data are
obtained.
The regression results for the folded design are shown in Table 6.4. Factors
B and AB appear highly significant, and factor D is highly insignificant (because
the p value is much greater than 0.1). As a result, factor D can be removed from
the analysis and the analysis redone to refine the model. (Recall that factors or
interactions should be removed only one at a time.) Subsequent regression
TAble6.4 Regression Results for Folded DOE
Coefficients Standard t Stat p Value
Error
Intercept 68.1875 0.719235 94.80558 3.83E – 12
A –2.4375 0.719235 –3.38902 0.011615
B –14.5625 0.719235 –20.2472 1.8E – 07
C 1.5625 0.719235 2.172447 0.066377
D –0.0625 0.719235 –0.0869 0.933186
AB = CD –6.9375 0.719235 –9.64566 2.71E – 05
AC = BD –0.8125 0.719235 –1.12967 0.295833
AD = BC 0.0625 0.719235 0.086898 0.933186
Block 0.8125 0.719235 1.129672 0.295833