Page 275 - Six Sigma Demystified
P. 275

Part 3  s i x   s i g m a  to o l s        255


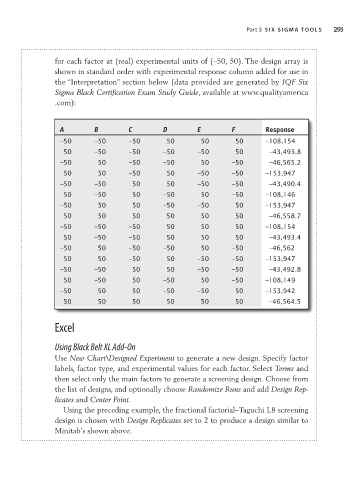
                           for each factor at (real) experimental units of (–50, 50). The design array is
                           shown in standard order with experimental response column added for use in
                           the “Interpretation” section below (data provided are generated by IQF Six
                           Sigma Black Certification Exam Study Guide, available at www.qualityamerica
                           .com):


                            A         B        C         D         E        F         Response
                            –50       –50       –50       50        50       50       –108,154
                             50       –50       –50      –50       –50       50        –43,493.8
                            –50        50       –50      –50        50      –50        –46,565.2
                             50        50       –50       50       –50      –50       –153,947
                            –50       –50       50        50       –50      –50        –43,490.4
                             50       –50       50       –50        50      –50       –108,146
                            –50        50       50       –50       –50       50       –153,947
                             50        50       50        50        50       50        –46,558.7
                            –50       –50      –50        50        50       50       –108,154
                             50       –50      –50        50        50       50        –43,493.4
                            –50        50      –50       –50        50      –50        –46,562
                             50        50      –50        50       –50      –50       –153,947
                            –50       –50       50        50       –50      –50        –43,492.8
                             50       –50       50       –50        50      –50       –108,149
                            –50        50       50       –50       –50       50       –153,942
                             50        50       50        50        50       50        –46,564.5


                           Excel


                           Using Black Belt XL Add-On
                           Use New Chart\Designed Experiment to generate a new design. Specify factor
                           labels, factor type, and experimental values for each factor. Select Terms and
                           then select only the main factors to generate a screening design. Choose from
                           the list of designs, and optionally choose Randomize Runs and add Design Rep-
                           licates and Center Point.
                             Using the preceding example, the fractional factorial–Taguchi L8 screening
                           design is chosen with Design Replicates set to 2 to produce a design similar to
                           Minitab’s shown above.
   270   271   272   273   274   275   276   277   278   279   280