
Page 278 - Six Sigma Demystified
P. 278
258 Six SigMa DemystifieD
Interpreting Results
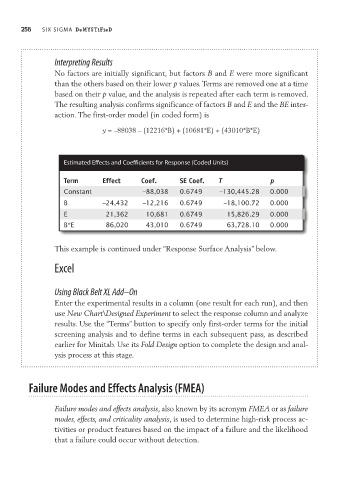
No factors are initially significant, but factors B and E were more significant
than the others based on their lower p values. Terms are removed one at a time
based on their p value, and the analysis is repeated after each term is removed.
The resulting analysis confirms significance of factors B and E and the BE inter-
action. The first-order model (in coded form) is
y = –88038 – (12216*B) + (10681*E) + (43010*B*E)
Estimated Effects and Coefficients for Response (Coded units)
Term Effect Coef. SE Coef. T p
Constant –88,038 0.6749 –130,445.28 0.000
B –24,432 –12,216 0.6749 –18,100.72 0.000
E 21,362 10,681 0.6749 15,826.29 0.000
B*E 86,020 43,010 0.6749 63,728.10 0.000
This example is continued under “Response Surface Analysis” below.
Excel
Using Black Belt XL Add–On
Enter the experimental results in a column (one result for each run), and then
use New Chart\Designed Experiment to select the response column and analyze
results. Use the “Terms” button to specify only first-order terms for the initial
screening analysis and to define terms in each subsequent pass, as described
earlier for Minitab. Use its Fold Design option to complete the design and anal-
ysis process at this stage.
Failure modes and effects Analysis (FmeA)
Failure modes and effects analysis, also known by its acronym FMEA or as failure
modes, effects, and criticality analysis, is used to determine high-risk process ac-
tivities or product features based on the impact of a failure and the likelihood
that a failure could occur without detection.