
Page 280 - Six Sigma Demystified
P. 280
260 Six SigMa DemystifieD
• Define the likelihood (or probability) of occurrence. Table T.11 (AIAG,
1995) provides useful descriptions of occurrence levels from 1 to 10 based
on C and possible process defect rates. For example:
pk
Failure mode 1: Product ID mistyped; occurrence level = 5.
• Define the detection method and likelihood of detection. Table T.12 pro-
vides useful descriptions of detection levels from 1 to 10. For example:
Failure mode 1: Product ID mistyped; detection = 4; detection method:
Accounting clerk compares the PO with the order form as the invoice
is created for shipping.
• Calculate risk priority number (RPN) by multiplying the severity, occur-
rence, and detection levels. For example:
Failure mode 1: Product ID mistyped; RPN = 120 [calculated as 6 (the
severity level) × 5 (the occurrence level) × 4 (the detection level)].
• Prioritize the failure modes based on the RPN.
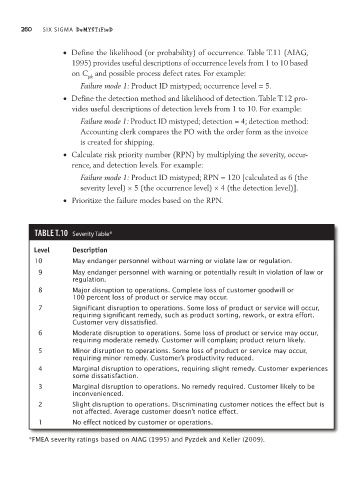
TAble T.10 Severity Table*
Level Description
10 May endanger personnel without warning or violate law or regulation.
9 May endanger personnel with warning or potentially result in violation of law or
regulation.
8 Major disruption to operations. Complete loss of customer goodwill or
100 percent loss of product or service may occur.
7 Significant disruption to operations. Some loss of product or service will occur,
requiring significant remedy, such as product sorting, rework, or extra effort.
Customer very dissatisfied.
6 Moderate disruption to operations. Some loss of product or service may occur,
requiring moderate remedy. Customer will complain; product return likely.
5 Minor disruption to operations. Some loss of product or service may occur,
requiring minor remedy. Customer’s productivity reduced.
4 Marginal disruption to operations, requiring slight remedy. Customer experiences
some dissatisfaction.
3 Marginal disruption to operations. No remedy required. Customer likely to be
inconvenienced.
2 Slight disruption to operations. Discriminating customer notices the effect but is
not affected. Average customer doesn’t notice effect.
1 No effect noticed by customer or operations.
*FMEA severity ratings based on AIAG (1995) and Pyzdek and Keller (2009).