
Page 281 - Six Sigma Demystified
P. 281
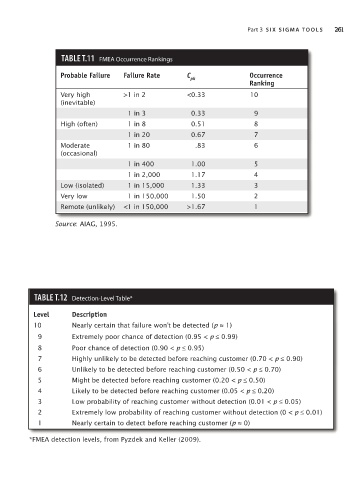
Part 3  s i x   s i g m a  to o l s        261


                             TAble T.11  FMEa Occurrence Rankings

                            Probable Failure    Failure Rate     C               Occurrence
                                                                 pk
                                                                                 Ranking
                            Very high         >1 in 2           <0.33            10
                            (inevitable)
                                                1 in 3           0.33             9
                            High (often)        1 in 8           0.51             8
                                                1 in 20          0.67             7
                            Moderate            1 in 80           .83             6
                            (occasional)
                                                1 in 400         1.00             5
                                                1 in 2,000       1.17             4
                            Low (isolated)      1 in 15,000      1.33             3
                            Very low            1 in 150,000     1.50             2
                            Remote (unlikely)  <1 in 150,000    >1.67             1

                           Source: AIAG, 1995.


                     TAble T.12  Detection-Level Table*
                     Level      Description

                     10         Nearly certain that failure won’t be detected (p ≈ 1)
                       9          Extremely poor chance of detection (0.95 < p ≤ 0.99)
                       8          Poor chance of detection (0.90 < p ≤ 0.95)
                       7          Highly unlikely to be detected before reaching customer (0.70 < p ≤ 0.90)
                       6        Unlikely to be detected before reaching customer (0.50 < p ≤ 0.70)
                       5        Might be detected before reaching customer (0.20 < p ≤ 0.50)
                       4        Likely to be detected before reaching customer (0.05 < p ≤ 0.20)
                       3        Low probability of reaching customer without detection (0.01 < p ≤ 0.05)
                       2        Extremely low probability of reaching customer without detection (0 < p ≤ 0.01)
                       1          Nearly certain to detect before reaching customer (p ≈ 0)


                    *FMEA detection levels, from Pyzdek and Keller (2009).