
Page 90 - Six Sigma Demystified
P. 90
Chapter 4 DEF INE STAGE 71
larger project than initially suspected. In such cases, the team should work with
the project sponsor to update the project charter with a redefined project
scope, timetable, and deliverable. The newly defined project then should be
reevaluated relative to the criteria established for project selection, as outlined
in Chapter 3.
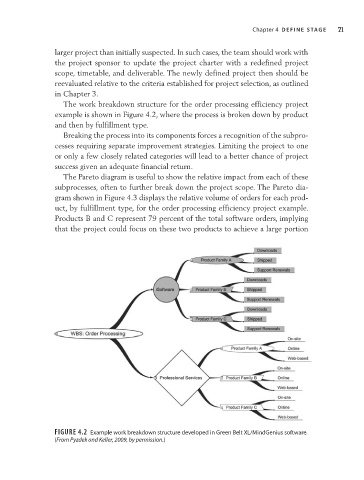
The work breakdown structure for the order processing efficiency project
example is shown in Figure 4.2, where the process is broken down by product
and then by fulfillment type.
Breaking the process into its components forces a recognition of the subpro-
cesses requiring separate improvement strategies. Limiting the project to one
or only a few closely related categories will lead to a better chance of project
success given an adequate financial return.
The Pareto diagram is useful to show the relative impact from each of these
subprocesses, often to further break down the project scope. The Pareto dia-
gram shown in Figure 4.3 displays the relative volume of orders for each prod-
uct, by fulfillment type, for the order processing efficiency project example.
Products B and C represent 79 percent of the total software orders, implying
that the project could focus on these two products to achieve a large portion
Figure 4.2 Example work breakdown structure developed in green Belt xL/Mindgenius software.
(From Pyzdek and Keller, 2009, by permission.)