
Page 91 - Six Sigma Demystified
P. 91
72 Six SigMa DemystifieD
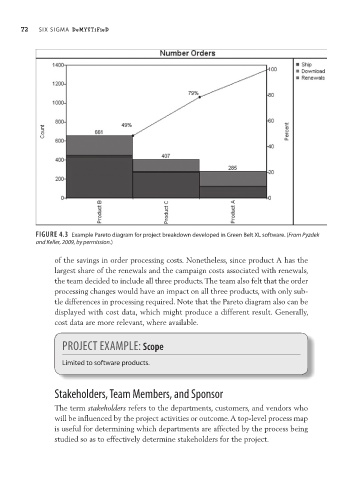
Figure 4.3 Example Pareto diagram for project breakdown developed in green Belt xL software. (From Pyzdek
and Keller, 2009, by permission.)
of the savings in order processing costs. Nonetheless, since product A has the
largest share of the renewals and the campaign costs associated with renewals,
the team decided to include all three products. The team also felt that the order
processing changes would have an impact on all three products, with only sub-
tle differences in processing required. Note that the Pareto diagram also can be
displayed with cost data, which might produce a different result. Generally,
cost data are more relevant, where available.
Project exAmPle: Scope
Limited to software products.
Stakeholders, team members, and Sponsor
The term stakeholders refers to the departments, customers, and vendors who
will be influenced by the project activities or outcome. A top- evel process map
l
is useful for determining which departments are affected by the process being
studied so as to effectively determine stakeholders for the project.