Page 168 - Six Sigma for electronics design and manufacturing
P. 168

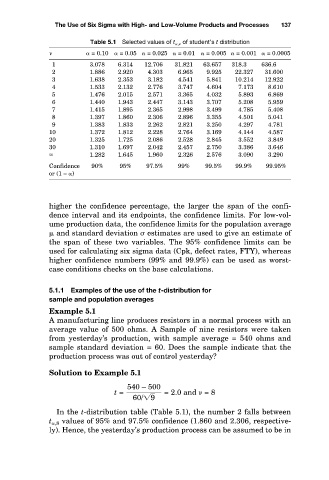
Table 5.1 Selected values of t  ,  of student’s t distribution
                                  = 0.10   = 0.05   = 0.025   = 0.01   = 0.005   = 0.001   = 0.0005

                                              12.706
                                                      31.821
                                        6.314
                                                                   318.3
                                                             63.657
                                 3.078
                                                                           636.6
                                                                    22.327
                                 1.886
                                                       6.965
                                        2.920
                                                                           31.600
                                               4.303
                                                             9.925
                                 1.638
                                                             5.841
                                                       4.541
                                               3.182
                                                                           12.922
                                                                    10.214
                                        2.353
                                 1.533
                                               2.776
                                                       3.747
                                                                     7.173
                                                             4.604
                                        2.132
                                 1.476
                                               2.571
                                        2.015
                                                                            6.869
                                                             4.032
                                                       3.365
                                                                     5.893
                                                                     5.208
                                                                            5.959
                                               2.447
                                        1.943
                                                             3.707
                                 1.440
                                                       3.143
                                                                     4.785
                                 1.415
                                               2.365
                                                                            5.408
                                                             3.499
                                        1.895
                                                       2.998
                                                                            5.041
                                                       2.896
                                                             3.355
                                                                     4.501
                                               2.306
                                 1.397
                                        1.860
                                 1.383
                        9 1 2 3 4 5 6 7 8 The Use of Six Sigma with High- and Low-Volume Products and Processes 8.610 137
                                                             3.250
                                                                     4.297
                                                       2.821
                                               2.262
                                                                            4.781
                                        1.833
                        10       1.372  1.812  2.228   2.764   3.169  4.144  4.587
                        20       1.325  1.725  2.086   2.528   2.845  3.552  3.849
                        30       1.310  1.697  2.042   2.457   2.750  3.386  3.646
                                 1.282  1.645  1.960   2.326   2.576  3.090  3.290
                        Confidence  90%  95%   97.5%   99%   99.5%  99.9%   99.95%
                        or (1 –  )
                        higher  the  confidence  percentage,  the  larger  the  span  of  the  confi-
                        dence interval and its endpoints, the confidence limits. For low-vol-
                        ume production data, the confidence limits for the population average
                          and standard deviation   estimates are used to give an estimate of
                        the  span  of  these  two  variables.  The  95%  confidence  limits  can  be
                        used for calculating six sigma data (Cpk, defect rates, FTY), whereas
                        higher  confidence  numbers  (99%  and  99.9%)  can  be  used  as  worst-
                        case conditions checks on the base calculations.
                        5.1.1  Examples of the use of the t-distribution for
                        sample and population averages
                        Example 5.1
                        A manufacturing line produces resistors in a normal process with an
                        average  value  of  500  ohms.  A  Sample  of  nine  resistors  were  taken
                        from  yesterday’s  production,  with  sample  average  =  540  ohms  and
                        sample standard deviation = 60. Does the sample indicate that the
                        production process was out of control yesterday?
                        Solution to Example 5.1
                                          540 – 500
                                       t =         = 2.0 and   = 8

                                            60/ 9
                         In the t-distribution table (Table 5.1), the number 2 falls between
                        t  ,8 values of 95% and 97.5% confidence (1.860 and 2.306, respective-
                        ly). Hence, the yesterday’s production process can be assumed to be in
   163   164   165   166   167   168   169   170   171   172   173