
Page 167 - Six Sigma for electronics design and manufacturing
P. 167
Six Sigma for Electronics Design and Manufacturing
136
tribution. The spread of the distribution decreases as the number of
degrees of freedom increases. The variance of the t distribution al-
ways exceeds 1, but it approaches 1 when the number n approaches
infinity. At that time, the t distribution becomes equal to the normal
distribution.
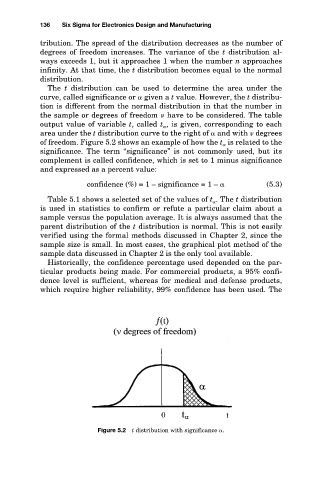
The t distribution can be used to determine the area under the
curve, called significance or given a t value. However, the t distribu-
tion is different from the normal distribution in that the number in
the sample or degrees of freedom have to be considered. The table
output value of variable t, called t , is given, corresponding to each
area under the t distribution curve to the right of and with degrees
of freedom. Figure 5.2 shows an example of how the t is related to the
significance. The term “significance” is not commonly used, but its
complement is called confidence, which is set to 1 minus significance
and expressed as a percent value:
confidence (%) = 1 – significance = 1 – (5.3)
Table 5.1 shows a selected set of the values of t . The t distribution
is used in statistics to confirm or refute a particular claim about a
sample versus the population average. It is always assumed that the
parent distribution of the t distribution is normal. This is not easily
verified using the formal methods discussed in Chapter 2, since the
sample size is small. In most cases, the graphical plot method of the
sample data discussed in Chapter 2 is the only tool available.
Historically, the confidence percentage used depended on the par-
ticular products being made. For commercial products, a 95% confi-
dence level is sufficient, whereas for medical and defense products,
which require higher reliability, 99% confidence has been used. The
Figure 5.2 t distribution with significance .