
Page 174 - Six Sigma for electronics design and manufacturing
P. 174
The Use of Six Sigma with High- and Low-Volume Products and Processes
2
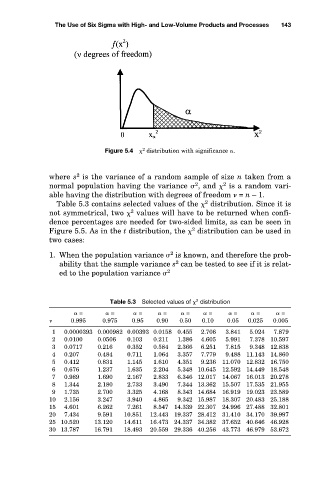
Figure 5.4 distribution with significance . 143
2
where s is the variance of a random sample of size n taken from a
2
2
normal population having the variance , and is a random vari-
able having the distribution with degrees of freedom = n – 1.
2
Table 5.3 contains selected values of the distribution. Since it is
not symmetrical, two values will have to be returned when confi-
2
dence percentages are needed for two-sided limits, as can be seen in
2
Figure 5.5. As in the t distribution, the distribution can be used in
two cases:
2
1. When the population variance is known, and therefore the prob-
2
ability that the sample variance s can be tested to see if it is relat-
ed to the population variance 2
Table 5.3 Selected values of distribution
2
= = = = = = = = =
0.995 0.975 0.95 0.90 0.50 0.10 0.05 0.025 0.005
1 0.0000393 0.000982 0.00393 0.0158 0.455 2.706 3.841 5.024 7.879
2 0.0100 0.0506 0.103 0.211 1.386 4.605 5.991 7.378 10.597
3 0.0717 0.216 0.352 0.584 2.366 6.251 7.815 9.348 12.838
4 0.207 0.484 0.711 1.064 3.357 7.779 9.488 11.143 14.860
5 0.412 0.831 1.145 1.610 4.351 9.236 11.070 12.832 16.750
6 0.676 1.237 1.635 2.204 5.348 10.645 12.592 14.449 18.548
7 0.989 1.690 2.167 2.833 6.346 12.017 14.067 16.013 20.278
8 1.344 2.180 2.733 3.490 7.344 13.362 15.507 17.535 21.955
9 1.735 2.700 3.325 4.168 8.343 14.684 16.919 19.023 23.589
10 2.156 3.247 3.940 4.865 9.342 15.987 18.307 20.483 25.188
15 4.601 6.262 7.261 8.547 14.339 22.307 24.996 27.488 32.801
20 7.434 9.591 10.851 12.443 19.337 28.412 31.410 34.170 39.997
25 10.520 13.120 14.611 16.473 24.337 34.382 37.652 40.646 46.928
30 13.787 16.791 18.493 20.559 29.336 40.256 43.773 46.979 53.672