
Page 193 - Six Sigma for electronics design and manufacturing
P. 193
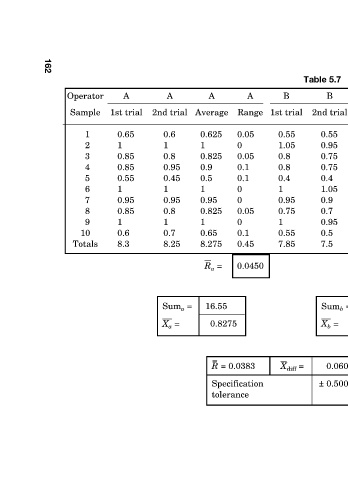
Table 5.7 GR&R example  PART  C  C  C  C  B  B  B  AVERAGE  Range  Average  2nd trial  1st trial  Range  Average 2nd trial  0.5667  0.05  0.525  0.55  0.5  0  0.55  0.55  1.0083  0.05  1.025  1  1.05  0.1  1  0.95  0.8000  0  0.8  0.8  0.8  0.05  0.775  0.75  0.8250  0  0.8  0.8  0.8  0.05  0.775  0.


                 B  1st trial  0.55  1.05  0.8  0.8  0.4  1  0.95  0.75  1  0.55  7.85  X diff =


                 A  Range  0.05  0  0.05  0.1  0.1  0  0  0.05  0  0.1  0.45  0.0450  = 0.0383  Specification
                    Average  0.625  1  0.825  0.9  0.5  1  0.95  0.825  1  0.65  8.275  R a
                 A                           =      16.55  0.8275  –  –  R  tolerance
                                                    =
                 A  2nd trial  0.6  1  0.8  0.95  0.45  1  0.95  0.8  1  0.7  8.25  Sum a  =      X a

                    1st trial  0.65  1  0.85  0.85  0.55  1  0.95  0.85  1  0.6  8.3
                 A
                 Operator  Sample  1  2  3  4  5  6  7  8  9  10  Totals


           162