
Page 192 - Six Sigma for electronics design and manufacturing
P. 192
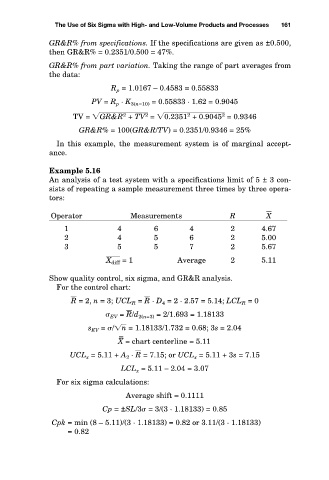
The Use of Six Sigma with High- and Low-Volume Products and Processes
                        GR&R% from specifications. If the specifications are given as ±0.500,
                        then GR&R% = 0.2351/0.500 = 47%.
                        GR&R% from part variation. Taking the range of part averages from
                        the data:
                                      R p = 1.0167 – 0.4583 = 0.55833
                                  PV = R p · K 3(n=10) = 0.55833 · 1.62 = 0.9045
                                                         2
                                         2
                                               2
                                                                 2
                             TV =  G  R & R  +  T V   =  0 .2 3 5 1  +  0 .9 0 4 5   = 0.9346
                               GR&R% = 100(GR&R/TV) = 0.2351/0.9346 = 25%      161
                         In  this  example,  the  measurement  system  is  of  marginal  accept-
                        ance.
                        Example 5.16
                        An analysis of a test system with a specifications limit of 5 ± 3 con-
                        sists of repeating a sample measurement three times by three opera-
                        tors:
                        Operator           Measurements            R        X
                           1            4        6       4         2       4.67
                           2            4        5       6         2       5.00
                           3            5        5       7         2       5.67
                                     X   d   i   f   f   = 1  Average  2   5.11
                        Show quality control, six sigma, and GR&R analysis.
                         For the control chart:
                             R   = 2, n = 3; UCL R = R   · D 4 = 2 · 2.57 = 5.14; LCL R = 0
                                       EV = R  /d 2(n=3) = 2/1.693 = 1.18133
                                 s EV =  / n  = 1.18133/1.732 = 0.68; 3s = 2.04
                                        – –
                                        X = chart centerline = 5.11
                             UCL x = 5.11 + A 2 · R   = 7.15; or UCL x = 5.11 + 3s = 7.15
                                         LCL x = 5.11 – 2.04 = 3.07
                         For six sigma calculations:
                                          Average shift = 0.1111
                                    Cp = ±SL/3  = 3/(3 · 1.18133) = 0.85
                        Cpk = min (8 – 5.11)/(3 · 1.18133) = 0.82 or 3.11/(3 · 1.18133)
                            = 0.82