
Page 188 - Six Sigma for electronics design and manufacturing
P. 188
The Use of Six Sigma with High- and Low-Volume Products and Processes
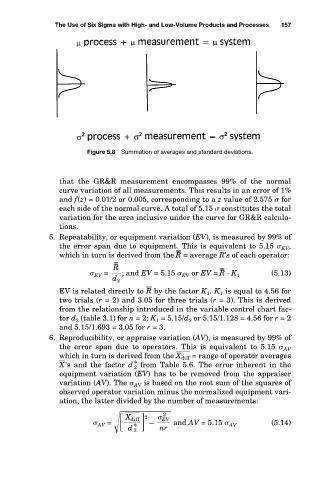
Figure 5.8 Summation of averages and standard deviations. 157
that the GR&R measurement encompasses 99% of the normal
curve variation of all measurements. This results in an error of 1%
and f(z) = 0.01/2 or 0.005, corresponding to a z value of 2.575 for
each side of the normal curve. A total of 5.15 constitutes the total
variation for the area inclusive under the curve for GR&R calcula-
tions.
5. Repeatability, or equipment variation (EV), is measured by 99% of
the error span due to equipment. This is equivalent to 5.15 EV ,
– –
which in turn is derived from the R = average R ’s of each operator:
– –
R – –
EV = ; and EV = 5.15 EV or EV = R · K 1 (5.13)
d 2
EV is related directly to R by the factor K 1 . K 1 is equal to 4.56 for
two trials (r = 2) and 3.05 for three trials (r = 3). This is derived
from the relationship introduced in the variable control chart fac-
tor d 2 (table 3.1) for n = 2: K 1 = 5.15/d 2 or 5.15/1.128 = 4.56 for r = 2
and 5.15/1.693 = 3.05 for r = 3.
6. Reproducibility, or appraise variation (AV), is measured by 99% of
the error span due to operators. This is equivalent to 5.15 AV
which in turn is derived from the X d i f f = range of operator averages
X ’s and the factor d * from Table 5.6. The error inherent in the
2
equipment variation (EV) has to be removed from the appraiser
variation (AV). The AV is based on the root sum of the squares of
observed operator variation minus the normalized equipment vari-
ation, the latter divided by the number of measurements:
2
X d i f f
2
EV
AV = – and AV = 5.15 AV (5.14)
d *
nr
2