
Page 185 - Six Sigma for electronics design and manufacturing
P. 185
Six Sigma for Electronics Design and Manufacturing
154
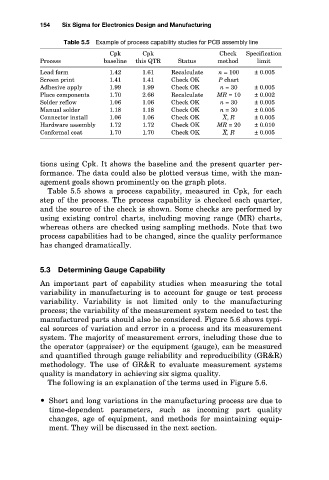
Table 5.5 Example of process capability studies for PCB assembly line
Cpk
Check
Cpk
Status
limit
Process
method
± 0.005
1.61
n = 100
1.42
Lead form
1.41
Screen print
P chart
Check OK
1.41
n = 30
1.99
Check OK
Adhesive apply
1.99
± 0.005
± 0.002
2.66
Recalculate
1.70
Place components
Check OK
1.06
Solder reflow
n = 30
± 0.005
1.06
n = 30
1.18
± 0.005
Manual solder
Check OK
1.18
1.06
Connector install
± 0.005
X , R
Check OK
1.06
± 0.010
1.72
Check OK
MR = 20
1.72
Hardware assembly baseline this QTR Recalculate MR = 10 Specification
Conformal coat 1.70 1.70 Check OK X , R ± 0.005
tions using Cpk. It shows the baseline and the present quarter per-
formance. The data could also be plotted versus time, with the man-
agement goals shown prominently on the graph plots.
Table 5.5 shows a process capability, measured in Cpk, for each
step of the process. The process capability is checked each quarter,
and the source of the check is shown. Some checks are performed by
using existing control charts, including moving range (MR) charts,
whereas others are checked using sampling methods. Note that two
process capabilities had to be changed, since the quality performance
has changed dramatically.
5.3 Determining Gauge Capability
An important part of capability studies when measuring the total
variability in manufacturing is to account for gauge or test process
variability. Variability is not limited only to the manufacturing
process; the variability of the measurement system needed to test the
manufactured parts should also be considered. Figure 5.6 shows typi-
cal sources of variation and error in a process and its measurement
system. The majority of measurement errors, including those due to
the operator (appraiser) or the equipment (gauge), can be measured
and quantified through gauge reliability and reproducibility (GR&R)
methodology. The use of GR&R to evaluate measurement systems
quality is mandatory in achieving six sigma quality.
The following is an explanation of the terms used in Figure 5.6.
Short and long variations in the manufacturing process are due to
time-dependent parameters, such as incoming part quality
changes, age of equipment, and methods for maintaining equip-
ment. They will be discussed in the next section.