
Page 180 - Six Sigma for electronics design and manufacturing
P. 180
149
The Use of Six Sigma with High- and Low-Volume Products and Processes
flated with Method 3. An example of a process out of control is one in
which one subgroup has a large sample average shift as opposed to
smaller average shifts in the other subgroups. Another way to advan-
tageously leverage Method 2 to negate the effect of average shift is to
use Method 4, with the data spread over time.
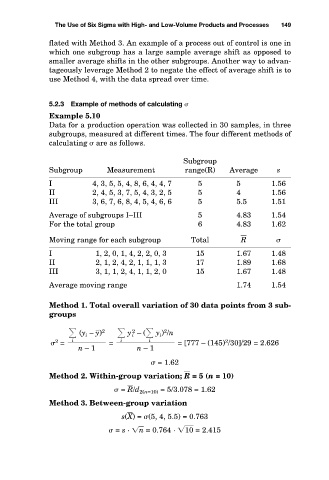
5.2.3 Example of methods of calculating
Example 5.10
Data for a production operation was collected in 30 samples, in three
subgroups, measured at different times. The four different methods of
calculating are as follows.
Subgroup
Subgroup Measurement range(R) Average s
I 4, 3, 5, 5, 4, 8, 6, 4, 4, 7 5 5 1.56
II 2, 4, 5, 3, 7, 5, 4, 3, 2, 5 5 4 1.56
III 3, 6, 7, 6, 8, 4, 5, 4, 6, 6 5 5.5 1.51
Average of subgroups I–III 5 4.83 1.54
For the total group 6 4.83 1.62
Moving range for each subgroup Total R
I 1, 2, 0, 1, 4, 2, 2, 0, 3 15 1.67 1.48
II 2, 1, 2, 4, 2, 1, 1, 1, 3 17 1.89 1.68
III 3, 1, 1, 2, 4, 1, 1, 2, 0 15 1.67 1.48
Average moving range 1.74 1.54
Method 1. Total overall variation of 30 data points from 3 sub-
groups
(y i – y) 2 y i – ( y i ) /n
2
2
i
i
i
= = = [777 – (145) /30]/29 = 2.626
2
2
n – 1 n – 1
= 1.62
Method 2. Within-group variation; R = 5 (n = 10)
= R /d 2(n=10) = 5/3.078 = 1.62
Method 3. Between-group variation
s(X ) = (5, 4, 5.5) = 0.763
= s · n = 0.764 · 1 0 = 2.415