
Page 223 - Soil and water contamination, 2nd edition
P. 223
210 Soil and Water Contamination
Loading function Breakthrough curve
Test begins Position of advective front
1.0 1.0
C/C 0 C/C 0
Test begins
0.0 0.0
Time Time
Porous medium
Porous medium
Porous medium
6642 6642 6642
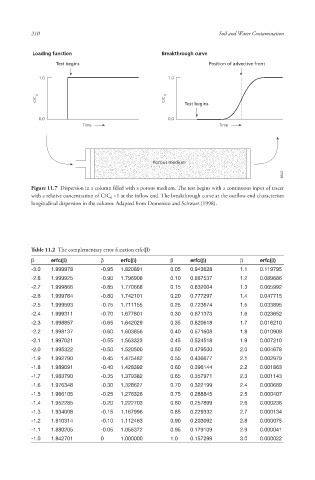
Figure 11.7 Dispersion in a column filled with a porous medium. The test begins with a continuous input of tracer
with a relative concentration of C/C 0 =1 at the inflow end. The breakthrough curve at the outflow end characterises
longitudinal dispersion in the column. Adapted from Domenico and Schwarz (1998).
Table 11.2 The complementary error function erfc(β)
β erfc(β) β erfc(β) β erfc(β) β erfc(β)
-3.0 1.999978 -0.95 1.820891 0.05 0.943628 1.1 0.119795
-2.8 1.999925 -0.90 1.796908 0.10 0.887537 1.2 0.089686
-2.7 1.999866 -0.85 1.770668 0.15 0.832004 1.3 0.065992
-2.6 1.999764 -0.80 1.742101 0.20 0.777297 1.4 0.047715
-2.5 1.999593 -0.75 1.711155 0.25 0.723674 1.5 0.033895
-2.4 1.999311 -0.70 1.677801 0.30 0.671373 1.6 0.023652
-2.3 1.998857 -0.65 1.642029 0.35 0.620618 1.7 0.016210
-2.2 1.998137 -0.60 1.603856 0.40 0.571608 1.8 0.010909
-2.1 1.997021 -0.55 1.563323 0.45 0.524518 1.9 0.007210
-2.0 1.995322 -0.50 1.520500 0.50 0.479500 2.0 0.004678
-1.9 1.992790 -0.45 1.475482 0.55 0.436677 2.1 0.002979
-1.8 1.989091 -0.40 1.428392 0.60 0.396144 2.2 0.001863
-1.7 1.983790 -0.35 1.379382 0.65 0.357971 2.3 0.001143
-1.6 1.976348 -0.30 1.328627 0.70 0.322199 2.4 0.000689
-1.5 1.966105 -0.25 1.276326 0.75 0.288845 2.5 0.000407
-1.4 1.952285 -0.20 1.222703 0.80 0.257899 2.6 0.000236
-1.3 1.934008 -0.15 1.167996 0.85 0.229332 2.7 0.000134
-1.2 1.910314 -0.10 1.112463 0.90 0.203092 2.8 0.000075
-1.1 1.880205 -0.05 1.056372 0.95 0.179109 2.9 0.000041
-1.0 1.842701 0 1.000000 1.0 0.157299 3.0 0.000022
10/1/2013 6:44:57 PM
Soil and Water.indd 222 10/1/2013 6:44:57 PM
Soil and Water.indd 222