
Page 324 - Soil and water contamination, 2nd edition
P. 324
Patterns in groundwater 311
a.
490
0 - 200
200 - 400
488 400 - 600
600 - 800
800 - 1000
486
1000 - 1250
1250 - 1500
Y (km) 484 1500 - 3000
3000 - 6000
6000 -12000
482
> 12000
480
6642
478
210 212 214 216 218 220 222 224 226
X (km)
b.
490
0 - 5
5 - 10
488 10 - 25
25 - 50
50 - 100
486
100 - 200
200 - 400
Y (km) 484 400 - 800
> 800
482
480
478
210 212 214 216 218 220 222 224 226
X (km)
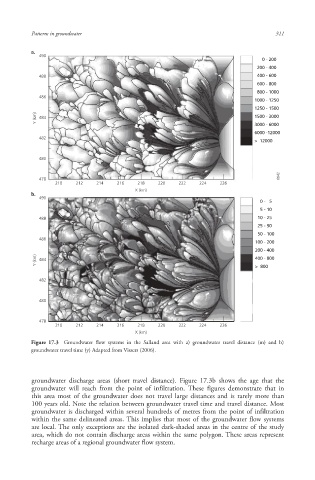
Figure 17.3 Groundwater flow systems in the Salland area with a) groundwater travel distance (m) and b)
groundwater travel time (y) Adapted from Vissers (2006).
groundwater discharge areas (short travel distance). Figure 17.3b shows the age that the
groundwater will reach from the point of infiltration. These figures demonstrate that in
this area most of the groundwater does not travel large distances and is rarely more than
100 years old. Note the relation between groundwater travel time and travel distance. Most
groundwater is discharged within several hundreds of metres from the point of infiltration
within the same delineated areas. This implies that most of the groundwater flow systems
are local. The only exceptions are the isolated dark-shaded areas in the centre of the study
area, which do not contain discharge areas within the same polygon. These areas represent
recharge areas of a regional groundwater flow system.
10/1/2013 6:45:35 PM
Soil and Water.indd 323 10/1/2013 6:45:35 PM
Soil and Water.indd 323