
Page 332 - Soil and water contamination, 2nd edition
P. 332
Patterns in groundwater 319
17.5 EFFECTS OF TEMPORAL VARIATION IN CONTAMINANT INPUTS
Temporal changes in contaminant inputs in groundwater recharge areas lead to changes in
concentrations along groundwater flow lines. In the long term at the regional scale or above,
the trends follow the general trends in diffuse anthropogenic emissions, particularly emissions
from agriculture. Since 1950, the influence of agriculture on groundwater quality has been
manifested as increased levels of nitrate in shallow groundwater in many countries in Europe
(e.g. Wendland, 1992; Roux, 1995; Dufour, 2000) and in North America (e.g. Burkart and
Stoner, 2002). The relation between nitrate concentrations in groundwater and fertiliser
application rates can be clearly revealed by determining the age (i.e. groundwater travel
time since recharge) of each groundwater sample through dating techniques rather than by
plotting the average nitrate concentration in groundwater against time (Bronswijk and Prins,
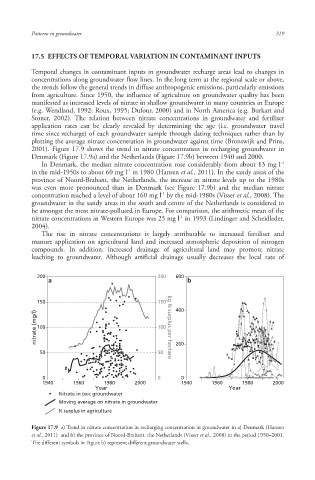
2001). Figure 17.9 shows the trend in nitrate concentration in recharging groundwater in
Denmark (Figure 17.9a) and the Netherlands (Figure 17.9b) between 1940 and 2000.
-1
In Denmark, the median nitrate concentration rose considerably from about 13 mg l
-1
in the mid-1950s to about 60 mg l in 1980 (Hansen et al., 2011). In the sandy areas of the
province of Noord-Brabant, the Netherlands, the increase in nitrate levels up to the 1980s
was even more pronounced than in Denmark (see Figure 17.9b) and the median nitrate
-1
concentration reached a level of about 160 mg l by the mid-1980s (Visser et al., 2008). The
groundwater in the sandy areas in the south and centre of the Netherlands is considered to
be amongst the most nitrate-polluted in Europe. For comparison, the arithmetic mean of the
-1
nitrate concentrations in Western Europe was 25 mg l in 1993 (Lindinger and Scheidleder,
2004).
The rise in nitrate concentrations is largely attributable to increased fertiliser and
manure application on agricultural land and increased atmospheric deposition of nitrogen
compounds. In addition, increased drainage of agricultural land may promote nitrate
leaching to groundwater. Although artificial drainage usually decreases the local rate of
Figure 17.9 a) Trend in nitrate concentration in recharging concentration in groundwater in a) Denmark (Hansen
et al., 2011) and b) the province of Noord-Brabant, the Netherlands (Visser et al., 2008) in the period 1950–2001.
The different symbols in Figure b) represent different groundwater wells.
10/1/2013 6:47:04 PM
Soil and Water.indd 331 10/1/2013 6:47:04 PM
Soil and Water.indd 331