
Page 336 - Soil and water contamination, 2nd edition
P. 336
Patterns in groundwater 323
56 days 101
ground
100
99
98
z (m) 97 reference line
96
source
95
94
93
92
-10 -5 0 5 10 15 20 25 30 35 40 45 50
125 days 101
100
99
98
z (m) 97
96
source 100
100
100
95
94
93
92
-10 -5 0 5 10 15 20 25 30 35 40 45 50
194 days 101
100
99
98
z (m) 97 1 1 1
96
0.1 0.01
0.1 0.01
source 0.1 0.01
100
100
95 100 10 10 10
94
93
92
-10 -5 0 5 10 15 20 25 30 35 40 45 50
322 days 101
100
99
98
z (m) 97 0.1 0.01
0.01
0.01
0.1
0.1
96
source 1 1 1
100
100
95 100 10 10 10
94
93
6642 6642 6642 92
-10 -5 0 5 10 15 20 25 30 35 40 45 50
Distance (m)
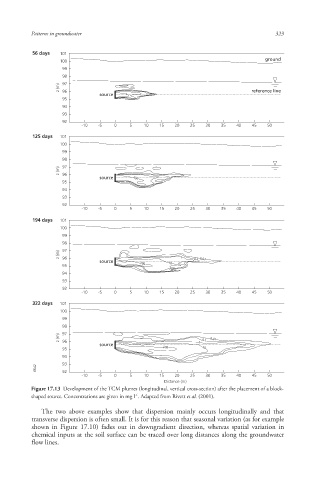
Figure 17.13 Development of the TCM plumes (longitudinal, vertical cross-section) after the placement of a block-
-1
shaped source. Concentrations are given in mg l . Adapted from Rivett et al. (2001).
The two above examples show that dispersion mainly occurs longitudinally and that
transverse dispersion is often small. It is for this reason that seasonal variation (as for example
shown in Figure 17.10) fades out in downgradient direction, whereas spatial variation in
chemical inputs at the soil surface can be traced over long distances along the groundwater
flow lines.
10/1/2013 6:47:06 PM
Soil and Water.indd 335 10/1/2013 6:47:06 PM
Soil and Water.indd 335