Page 338 - Soil and water contamination, 2nd edition
P. 338

Patterns in groundwater                                               325

                    a                      Cl -  b                     K +   Concentration (mgl -1 )
                                                                             Infiltration beds
                                                                             Groundwater sampling
                                                                             site
                                                                             Sampling site 11


                                                            20 20 20
                                800
                                800
                                800
                                                           10 10 10
                                500
                                500
                                500
                                                            5 5 5
                               200
                               200
                               200
                                                                                           6642  6642  6642
                                                 +
                                          -
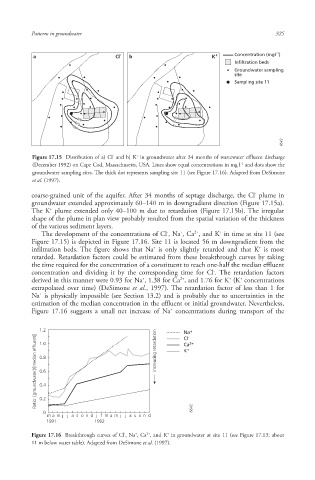
                    Figure 17.15  Distribution of a) Cl  and b) K  in groundwater after 34 months of wastewater effluent  discharge
                                                                               -1
                    (December 1992) on Cape Cod , Massachusetts, USA. Lines show equal concentrations in mg l  and dots show the
                    groundwater sampling sites. The thick dot represents sampling site 11 (see Figure 17.16). Adapted from DeSimone
                    et al. (1997).
                                                                                   -
                   coarse-grained unit of the aquifer. After 34 months of septage discharge, the Cl  plume in
                   groundwater extended approximately 60–140 m in downgradient direction (Figure 17.15a).
                         +
                   The K   plume extended only 40–100 m due to retardation (Figure 17.15b). The irregular
                   shape of the plume in plan view probably resulted from the spatial variation of the thickness
                   of the various sediment layers.
                                                              +
                                                                         +
                                                                  2+
                                                          -
                      The development of the concentrations of Cl , Na , Ca , and K  in time at site 11 (see
                   Figure 17.15) is depicted in Figure 17.16. Site 11 is located 56 m downgradient from the
                                                                                    +
                                                      +
                   infiltration  beds. The figure shows that Na  is only slightly retarded and that K  is most
                   retarded. Retardation factors could be estimated from these breakthrough curve s by taking
                   the time required for the concentration of a constituent to reach one-half the median effluent
                                                                       -
                   concentration and dividing it by the corresponding time for Cl . The retardation  factor s
                                                   +
                                                                            +
                                                              2+
                                                                               +
                   derived in this manner were 0.93 for Na , 1.38 for Ca , and 1.76 for K  (K  concentrations
                   extrapolated over time) (DeSimone et al., 1997). The retardation factor of less than 1 for
                      +
                   Na  is physically impossible (see Section 13.2) and is probably due to uncertainties in the
                   estimation of the median concentration in the effluent or initial groundwater. Nevertheless,
                                                           +
                   Figure 17.16 suggests a small net increase of Na  concentrations during transport of the
                      1.2                                      Na + -  + 2+
                     Ratio: [groundwater]/[median effluent]]  0.8  increasing retardation  K
                                                               Cl
                      1.0
                                                               Ca
                      0.6
                      0.4
                      0.2
                       0                                         6642  6642  6642
                        m  a  m j ja s o n d j f m a m j ja s o n d
                        1991         1992
                                                    2+
                                                 +
                                              -
                                                          +
                   Figure 17.16  Breakthrough curves of Cl , Na , Ca , and K  in groundwater at site 11 (see Figure 17.13; about
                   11 m below water table ). Adapted from DeSimone et al. (1997).
                                                                                            10/1/2013   6:47:06 PM
        Soil and Water.indd   337
        Soil and Water.indd   337                                                           10/1/2013   6:47:06 PM
   333   334   335   336   337   338   339   340   341   342   343