
Page 333 - Soil and water contamination, 2nd edition
P. 333
320 Soil and Water Contamination
groundwater recharge, it has a widespread effect on the groundwater level. When the
groundwater level falls, the upper soil horizons become more aerated, which, in turn, results
in enhanced nitrate production through ammonification and subsequent nitrification. It may
also cause water deficiencies in the root zone, so that nitrate is taken up by the vegetation less
efficiently. In sandy recharge areas in particular, where the shallow groundwater is usually
well aerated, nitrate is very mobile and is barely affected by denitrification. The large scatter
around the general trend line is caused by differences in manure and fertiliser application
rates or differences in nitrate leaching rates between the measurement locations or the
years. Nitrate leaching increases with increasing net precipitation and this effect is generally
stronger than the dilution effect brought about by increased net precipitation. As a result,
wet years are reflected as zones of higher nitrate concentrations in groundwater, whereas dry
years appear as zones of lower nitrate concentrations.
Since the mid-1980s, the nitrate concentrations in recharging groundwater have been
declining, both in Denmark and in the Netherlands. This downward trend is mainly due to
decreasing inputs of fertilisers as a result of EU policy to protect water against pollution by
nitrate from agricultural sources. This decreasing trend in recharging groundwater has not yet
become apparent in a decreasing trend in nitrate concentrations at all monitoring locations,
because the discharge year of the sampled groundwater was before the mid-1980s. In about
one-third of the national monitoring locations in Europe the trend in nitrate concentrations
is upwards, in another third the trend is stable, and in the last third the trend is downwards
(EC, 2011). In some regions, a decreasing trend has also become apparent in the mean
nitrate concentrations over larger areas. For example, the mean nitrate concentrations in
shallow groundwater below agricultural land in the central part of the Netherlands (province
of Gelderland) have been declining since 1993 (Province of Gelderland, 2013). The delay
in response of the mean nitrate concentration to the decline in nitrate concentrations
in the recharging groundwater can be mainly attributed to the travel time between the
points of infiltration and the locations of the groundwater wells. Nevertheless, The nitrate
concentrations in the deep groundwater have continued to rise, since the deeper groundwater
is older than the shallow groundwater and includes more water that infiltrated during the
1970s and 1980s when the fertiliser application rates and the corresponding nitrate leaching
rates were at their maximum.
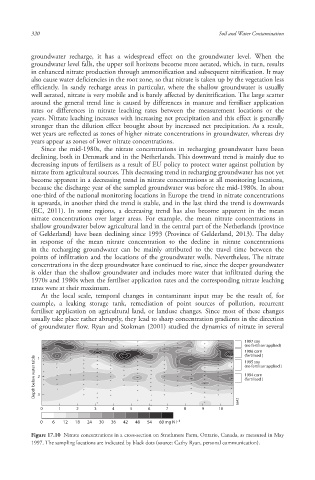
At the local scale , temporal changes in contaminant input may be the result of, for
example, a leaking storage tank, remediation of point source s of pollution, recurrent
fertiliser application on agricultural land, or landuse changes. Since most of these changes
usually take place rather abruptly, they lead to sharp concentration gradients in the direction
of groundwater flow . Ryan and Stokman (2001) studied the dynamics of nitrate in several
1997 soy
(no fertiliser applied)
1996 corn
Depth below water table 2 (no fertiliser applied )
(fertilised )
1
1995 soy
1994 corn
(fertilised )
3
6642 6642 6642
0 1 2 3 4 5 6 7 8 8 9 10
0 66 12 18 24 30 36 42 48 54 60 mg N l -1
60
Figure 17.10 Nitrate concentrations in a cross-section on Strathmere Farm, Ontario, Canada, as measured in May
1997. The sampling locations are indicated by black dots (source: Cathy Ryan, personal communication).
10/1/2013 6:47:05 PM
Soil and Water.indd 332
Soil and Water.indd 332 10/1/2013 6:47:05 PM