
Page 352 - Soil and water contamination, 2nd edition
P. 352
Patterns in surface water 339
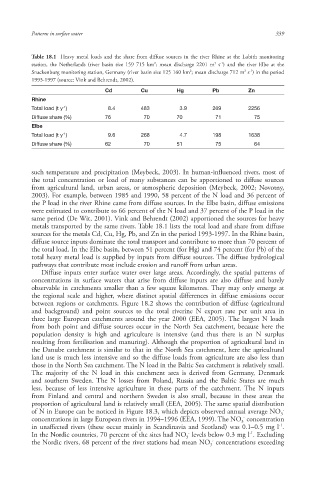
Table 18.1 Heavy metal loads and the share from diffuse source s in the river Rhine at the Lobith monitoring
2
3
-1
station, the Netherlands (river basin size 159 715 km ; mean discharge 2201 m s ) and the river Elbe at the
-1
3
2
Snackenburg monitoring station, Germany (river basin size 125 160 km ; mean discharge 712 m s ) in the period
1993-1997 (source: Vink and Behrendt, 2002).
Cd Cu Hg Pb Zn
Rhine
-1
Total load (t y ) 8.4 483 3.9 269 2256
Diffuse share (%) 76 70 70 71 75
Elbe
-1
Total load (t y ) 9.6 268 4.7 198 1638
Diffuse share (%) 62 70 51 75 64
such temperature and precipitation (Meybeck, 2003). In human-influenced rivers, most of
the total concentration or load of many substances can be apportioned to diffuse source s
from agricultural land, urban areas, or atmospheric deposition (Meybeck, 2002; Novotny,
2003). For example, between 1985 and 1990, 58 percent of the N load and 36 percent of
the P load in the river Rhine came from diffuse sources. In the Elbe basin, diffuse emissions
were estimated to contribute to 66 percent of the N load and 37 percent of the P load in the
same period (De Wit, 2001). Vink and Behrendt (2002) apportioned the sources for heavy
metals transported by the same rivers. Table 18.1 lists the total load and share from diffuse
sources for the metals Cd, Cu, Hg, Pb, and Zn in the period 1993-1997. In the Rhine basin,
diffuse source inputs dominate the total transport and contribute to more than 70 percent of
the total load. In the Elbe basin, between 51 percent (for Hg) and 74 percent (for Pb) of the
total heavy metal load is supplied by inputs from diffuse sources. The diffuse hydrological
pathways that contribute most include erosion and runoff from urban areas.
Diffuse inputs enter surface water over large areas. Accordingly, the spatial patterns of
concentrations in surface waters that arise from diffuse inputs are also diffuse and barely
observable in catchments smaller than a few square kilometres. They may only emerge at
the regional scale and higher, where distinct spatial differences in diffuse emissions occur
between regions or catchments. Figure 18.2 shows the contribution of diffuse (agricultural
and background) and point sources to the total riverine N export rate per unit area in
three large European catchments around the year 2000 (EEA, 2005). The largest N loads
from both point and diffuse sources occur in the North Sea catchment, because here the
population density is high and agriculture is intensive (and thus there is an N surplus
resulting from fertilisation and manuring). Although the proportion of agricultural land in
the Danube catchment is similar to that in the North Sea catchment, here the agricultural
land use is much less intensive and so the diffuse loads from agriculture are also less than
those in the North Sea catchment. The N load in the Baltic Sea catchment is relatively small.
The majority of the N load in this catchment area is derived from Germany, Denmark
and southern Sweden. The N losses from Poland, Russia and the Baltic States are much
less, because of less intensive agriculture in these parts of the catchment. The N inputs
from Finland and central and northern Sweden is also small, because in these areas the
proportion of agricultural land is relatively small (EEA, 2005). The same spatial distribution
of N in Europe can be noticed in Figure 18.3, which depicts observed annual average NO -
3
-
concentrations in large European rivers in 1994–1996 (EEA, 1999). The NO concentration
3
-1
in unaffected rivers (these occur mainly in Scandinavia and Scotland) was 0.1–0.5 mg l .
-1
-
In the Nordic countries, 70 percent of the sites had NO levels below 0.3 mg l . Excluding
3
-
the Nordic rivers, 68 percent of the river stations had mean NO concentrations exceeding
3
10/1/2013 6:47:10 PM
Soil and Water.indd 351
Soil and Water.indd 351 10/1/2013 6:47:10 PM