
Page 356 - Soil and water contamination, 2nd edition
P. 356
Patterns in surface water 343
such streams there is less reach-specific removal, and the flow paths and associated transit
times to the catchment outlet are shorter. This is the main reason that downstream areas
close to the catchment outlet generally contribute much more to the diffuse catchment N
export than the headwaters far away from the catchment outlet.
18.2.2 Effects of point source s
Point source discharges of pollutants into rivers can have major adverse effects on
downstream water quality. The increase in concentrations of the substances discharged is
most apparent in the reach directly downstream of the discharge, since most substances are
affected by physical and chemical processes during downstream transport, such as dilution,
volatilisation , sorption to suspended and bed sediments , biochemical decay, uptake by
organisms, or exchange between the stream or river channel and the hyporheic zone. These
processes are generally referred to as the self-cleaning capacity of a river and generally lead to
a decrease in pollutant concentrations in downstream direction. The distance at which the
concentration of a substance reaches a certain fraction of the peak concentration depends on
the nature of the processes acting upon the substance and the rates at which these processes
occur.
-
3-
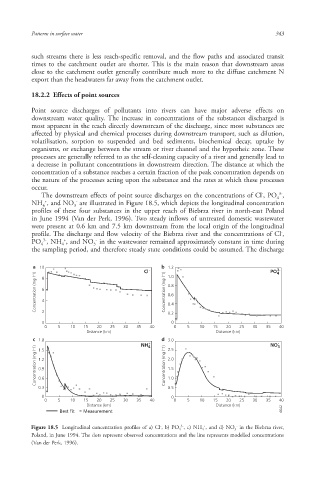
The downstream effects of point source discharges on the concentrations of Cl , PO ,
4
-
+
NH , and NO are illustrated in Figure 18.5, which depicts the longitudinal concentration
4 3
profiles of these four substances in the upper reach of Biebrza river in north-east Poland
in June 1994 (Van der Perk, 1996). Two steady inflows of untreated domestic wastewater
were present at 0.6 km and 7.5 km downstream from the local origin of the longitudinal
-
profile. The discharge and flow velocity of the Biebrza river and the concentrations of Cl ,
-
3-
+
PO , NH , and NO in the wastewater remained approximately constant in time during
4 4 3
the sampling period, and therefore steady state conditions could be assumed. The discharge
a 10 b 1.2
Cl - 1.0 PO 4 3-
Concentration (mg l - 1) 6 4 Concentration (mg l - 1) 0.8
8
0.6
0.4
0 2 0.2 0
0 5 10 15 20 25 30 35 40 0 5 10 15 20 25 30 35 40
Distance (km) Distance (km)
c 1.8 d 3.0
NH + 2.5 NO 3 -
NH 44
Concentration (mg l - 1) 1.2 Concentration (mg l - 1) 2.0
1.5
1.5
0.9
0.6
0.3 1.0
0.5
0 0
0 5 10 15 20 25 30 35 40 0 5 10 15 20 25 30 35 40
Distance (km) Distance (km)
Best fit Measurement 6642 6642 6642
+
-
3-
-
Figure 18.5 Longitudinal concentration profiles of a) Cl , b) PO 4 , c) NH 4 , and d) NO 3 in the Biebrza river,
Poland, in June 1994. The dots represent observed concentrations and the line represents modelled concentrations
(Van der Perk, 1996).
10/1/2013 6:47:11 PM
Soil and Water.indd 355 10/1/2013 6:47:11 PM
Soil and Water.indd 355