Page 360 - Soil and water contamination, 2nd edition
P. 360

Patterns in surface water                                             347
                   a  120                                b 120
                                                                                           6955
                      100
                                                           100
                     Concentration (mg l -1 )/  Discharge (m 3  s -1 )  80  Concentration (mg l -1 )  80
                                                           60
                       60
                                                           40
                       40
                       20
                       0                                   20 0
                              50   100   150   200   250          10    20    40    60    80
                                     Time (h)
                                                                       Discharge (m 3 /s)
                   c  120                                d 120
                      100
                                                           100
                     Concentration (mg l -1 )/  Discharge (m 3  s -1 )  80  Concentration (mg l -1 )  80
                       60
                                                           60
                       40
                                                           40
                       20
                       0                                   20 0
                              50   100   150   200   250          10    20    40    60    80
                                     Time (h)                          Discharge (m 3 /s)
                   e  120                                f 120
                                                           100
                      100
                     Concentration (mg l -1 )/  Discharge (m 3  s -1 )  80  Concentration (mg l -1 )  80
                       60
                                                           60
                                                           40
                       40
                       20
                       0                                   20 0
                              50   100   150   200   250          10    20    40    60    80
                                     Time (h)                          Discharge (m 3 /s)
                   g  120                                h 120
                      100
                                                           100
                     Concentration (mg l -1 )/  Discharge (m 3  s -1 )  80  Concentration (mg l -1 )  80
                                                           60
                       60
                       40
                                                           40
                       20
                       0                                   20 0
                              50   100   150   200   250          10    20    40    60    80
                                     Time (h)                          Discharge (m 3 /s)
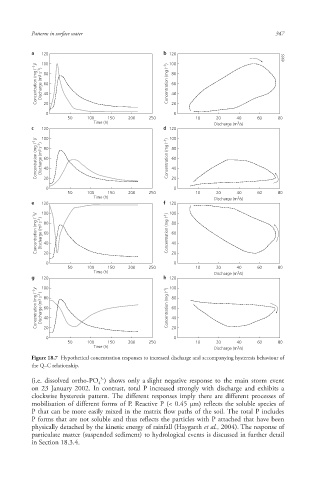
                   Figure 18.7  Hypothetical concentration responses to increased discharge and accompanying hysteresis  behaviour of
                   the Q–C relationship.
                                       3-
                   (i.e. dissolved ortho-PO ) shows only a slight negative response to the main storm event
                                      4
                   on 23 January 2002. In contrast, total P increased strongly with discharge and exhibits a
                   clockwise hysteresis pattern. The different responses imply there are different processes of
                   mobilisation of different forms of P. Reactive P (< 0.45 μm) reflects the soluble species of
                   P that can be more easily mixed in the matrix flow paths of the soil. The total P includes
                   P forms that are not soluble and thus reflects the particles with P attached that have been
                   physically detached by the kinetic energy of rainfall (Haygarth et al., 2004). The response of
                   particulate matter  (suspended sediment ) to hydrological events is discussed in further detail
                   in Section 18.3.4.


                                                                                            10/1/2013   6:47:12 PM
        Soil and Water.indd   359                                                           10/1/2013   6:47:12 PM
        Soil and Water.indd   359
   355   356   357   358   359   360   361   362   363   364   365