Page 365 - Soil and water contamination, 2nd edition
P. 365
352                                                  Soil and Water Contamination

                      1000
                                                                                    a = 2.62  6642  6642  6642
                                                                                    b = 0.33

                     Suspended solids concentration (mg l -1 )  100


                        10


                                                                          Uncorrected rating curve
                                                                          Corrected rating curve
                                                                          Obervations
                        1
                        1000                                                            10000
                                                     Discharge (m 3  s -1 )
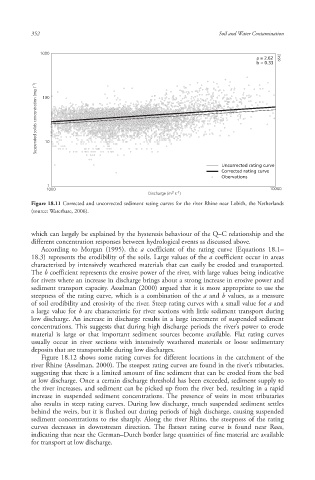
                    Figure 18.11 Corrected and uncorrected sediment  rating curves  for the river Rhine  near Lobith, the Netherlands
                    (source: Waterbase, 2006).

                    which can largely be explained by the hysteresis  behaviour of the Q–C relationship and the
                    different concentration responses between hydrological events as discussed above.
                       According to Morgan (1995), the  a  coefficient of the rating curve  (Equations 18.1–
                    18.3) represents the erodibility of the soils. Large values of the a coefficient occur in areas
                    characterised by intensively weathered materials that can easily be eroded and transported.
                    The b coefficient represents the erosive power of the river, with large values being indicative
                    for rivers where an increase in discharge brings about a strong increase in erosive power and
                    sediment  transport capacity . Asselman (2000) argued that it is more appropriate to use the
                    steepness of the rating curve, which is a combination of the a and b values, as a measure
                    of soil erodibility and erosivity of the river. Steep rating curves with a small value for a and
                    a large value for b are characteristic for river sections with little sediment transport during
                    low discharge. An increase in discharge results in a large increment of suspended sediment
                    concentrations. This suggests that during high discharge periods the river’s power to erode
                    material is large or that important sediment sources become available. Flat rating curves
                    usually occur in river sections with intensively weathered materials or loose sedimentary
                    deposits that are transportable during low discharges.
                       Figure 18.12 shows some rating curve s for different locations in the catchment  of the
                    river Rhine  (Asselman, 2000). The steepest rating curves are found in the river’s tributaries,
                    suggesting that there is a limited amount of fine sediment  that can be eroded from the bed
                    at low discharge. Once a certain discharge threshold has been exceeded, sediment supply to
                    the river increases, and sediment can be picked up from the river bed, resulting in a rapid
                    increase in suspended sediment  concentrations. The presence of weirs in most tributaries
                    also results in steep rating curves. During low discharge, much suspended sediment settles
                    behind the weirs, but it is flushed out during periods of high discharge, causing suspended
                    sediment concentrations to rise sharply. Along the river Rhine , the steepness of the rating
                    curves decreases in downstream direction.  The flattest rating curve is found near Rees,
                    indicating that near the German–Dutch border large quantities of fine material are available
                    for transport at low discharge.


                                                                                            10/1/2013   6:47:13 PM
        Soil and Water.indd   364                                                           10/1/2013   6:47:13 PM
        Soil and Water.indd   364

