
Page 369 - Soil and water contamination, 2nd edition
P. 369
356 Soil and Water Contamination
-
3-
+
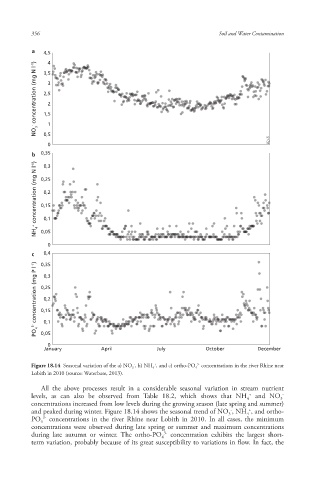
Figure 18.14 Seasonal variation of the a) NO 3 , b) NH 4 , and c) ortho-PO 4 concentrations in the river Rhine near
Lobith in 2010 (source: Waterbase, 2013).
All the above processes result in a considerable seasonal variation in stream nutrient
+
levels, as can also be observed from Table 18.2, which shows that NH and NO -
4 3
concentrations increased from low levels during the growing season (late spring and summer)
+
-
and peaked during winter. Figure 18.14 shows the seasonal trend of NO , NH , and ortho-
4
3
3-
PO concentrations in the river Rhine near Lobith in 2010. In all cases, the minimum
4
concentrations were observed during late spring or summer and maximum concentrations
3-
during late autumn or winter. The ortho-PO concentration exhibits the largest short-
4
term variation, probably because of its great susceptibility to variations in flow. In fact, the
10/1/2013 6:47:13 PM
Soil and Water.indd 368
Soil and Water.indd 368 10/1/2013 6:47:13 PM