
Page 373 - Soil and water contamination, 2nd edition
P. 373
360 Soil and Water Contamination
resulted in increased diffuse P sources, and because enhanced connection to wastewater
treatment systems caused an increase in direct P emissions to the river. Since the 1980s the
improvement of waste water treatment by implementing tertiary treatment (additional P
removal) and the phasing out of phosphorus -containing detergents have led to a noticeable
3-
decline of ortho-PO concentrations in the river water (Van Dijk et al., 1996). The
4
maximum dissolved Zn concentrations in river water were measured in the early 1970s.
Since then, various measures to reduce heavy metal loads from industrial and municipal
waste water discharges have resulted in lower – though still elevated – Zn levels in the river
Rhine . Currently, the bulk of Zn originates from diffuse source s (see Table 18.1).
The above example shows a relatively quick response of water quality to improved
sanitation of wastewater discharges. However, the response of water quality to changes in
diffuse emissions is often much slower, as illustrated by the trends in river water quality in
central and eastern Europe following the collapse of communism in the late 1980s and the
consequent agricultural crisis and accompanying drastic decrease in the use of fertilisers . For
example, in Estonia , there was heavy use of mineral fertilisers in agriculture during the Soviet
-1
period, i.e. before 1991. In 1987 and 1988, when this use was highest, 270 000 t y was
-1
being applied. By 2001, the fertiliser consumption rate in Estonia had fallen to 29 700 t y .
-1
Livestock numbers also fell, from 800 000 (0.82 livestock units ha of agricultural land)
-1
in 1988 to less than 390 000 (0.34 livestock units ha ) in 1994. In addition, the area of
abandoned land increased substantially. Mourad and Van der Perk (2004) estimated the decline
-2
-1
in mean annual diffuse source emissions in Estonia to be from 5953 kg km y for 1985–1989
-1
-2
to 2009 kg km y for 1995–1999. Because the N in most Estonian rivers originates largely
from diffuse source emissions (see Mourad and Van der Perk, 2004), the possible effects of the
decreased diffuse inputs should ultimately become noticeable in the stream N concentrations.
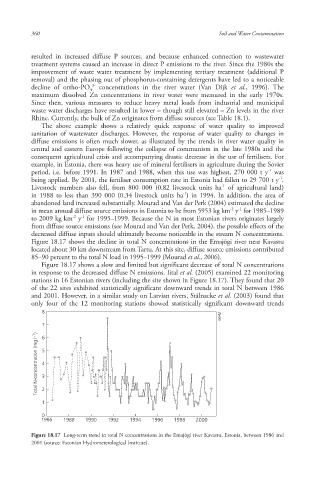
Figure 18.17 shows the decline in total N concentrations in the Emajõgi river near Kavastu
located about 30 km downstream from Tartu. At this site, diffuse source emissions contributed
85–90 percent to the total N load in 1995–1999 (Mourad et al., 2006).
Figure 18.17 shows a slow and limited but significant decrease of total N concentrations
in response to the decreased diffuse N emissions. Iital et al. (2005) examined 22 monitoring
stations in 16 Estonian rivers (including the site shown in Figure 18.17). They found that 20
of the 22 sites exhibited statistically significant downward trends in total N between 1986
and 2001. However, in a similar study on Latvian rivers, Stålnacke et al. (2003) found that
only four of the 12 monitoring stations showed statistically significant downward trends
8
6642 6642 6642
7 6
Total N-concentration (mg l -1 ) 5 4 3
1 2
0
1986 1988 1990 1992 1994 1996 1998 2000
Figure 18.17 Long-term trend in total N concentrations in the Emajõgi river Kavastu, Estonia, between 1986 and
2001 (source: Estonian Hydrometerological Institute).
10/1/2013 6:47:49 PM
Soil and Water.indd 372 10/1/2013 6:47:49 PM
Soil and Water.indd 372