
Page 368 - Soil and water contamination, 2nd edition
P. 368
Patterns in surface water 355
contaminants from catchments. However, during periods of high discharge there is a
dramatic increase not only in the load of sediment-associated substances, but also in the
load of sediment itself and the load of dissolved substances that exhibit a positive Q–C
relationship. Hence hydrological events often account for the bulk of the export of these
substances from catchments, even though they only occur during a short time of the year.
For example, Baker and Richards (2003) quantified the relative contributions to total
sediment and nutrient load from the Maumee River at Waterville, Ohio, USA, to Lake Erie
due to runoff events. In a 17-year period, there were 226 discrete storm events, which lasted
for 37.2 percent of the time but accounted for 76.4 percent of the water discharge, 91.6
percent of the sediment export, 86.4 percent of the total phosphorus export, 78.3 percent
of the soluble reactive phosphorus export, and 80.5 percent of the nitrate -nitrogen export.
This contribution of episodic hydrological events to the total export of substances from a
catchment can be especially large in small catchments, due to their flashy nature.
18.3.7 Seasonal dynamics of nutrient concentrations
As mentioned above, the supply of substances to watercourses varies with the seasons, due
to plant uptake and litter fall. Because dissolved inorganic N and P species in soil are taken
up during the growing season, plant uptake particularly affects the transfer of nutrients to
surface water. In autumn, some of the nutrients are released again through litterfall and
subsequent mineralisation . Though most of the P is retained in soil, dissolved N species
+
-
(i.e. NO and to a lesser extent NH ) can readily be flushed to the stream by surface and
3 4
shallow subsurface pathways during winter storms or spring snowmelt. Besides the seasonal
variation in supply of nutrients from the terrestrial parts of the catchment , there is seasonal
variation resulting from algae and aquatic macrophytes: during the growing season, these
take up nutrients dissolved in surface water. Furthermore, the seasonal variation of the
water temperature has a pronounced effect on the rates of biochemical decay. The rates of
nitrification and denitrification decrease with decreasing temperature. When the water
temperature drops below about 10 °C, nitrification and denitrification virtually cease. This
+
-
means that during winter, NO and NH are less efficiently removed from the water, so
3 4
that their concentrations remain relatively high. When the water temperature rises, the
nitrification and denitrification processes resume, at rates increasing with temperature,
+
-
thereby lowering the in-stream NO and NH concentrations.
3 4
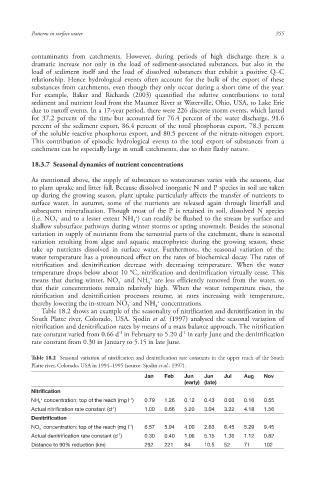
Table 18.2 shows an example of the seasonality of nitrification and denitrification in the
South Platte river, Colorado, USA. Sjodin et al. (1997) analysed the seasonal variation of
nitrification and denitrification rates by means of a mass balance approach. The nitrification
-1
-1
rate constant varied from 0.66 d in February to 5.20 d in early June and the denitrification
rate constant from 0.30 in January to 5.15 in late June.
Table 18.2 Seasonal variation of nitrification and denitrification rate constants in the upper reach of the South
Platte river, Colorado, USA in 1994–1995 (source: Sjodin et al., 1997).
Jan Feb Jun Jun Jul Aug Nov
(early) (late)
Nitrification
+
-1
NH 4 concentration; top of the reach (mg l ) 0.79 1.26 0.12 0.43 0.03 0.16 0.55
-1
Actual nitrification rate constant (d ) 1.00 0.66 5.20 3.04 3.22 4.18 1.56
Denitrification
-
-1
NO 3 concentration; top of the reach (mg l ) 6.57 5.94 4.00 2.63 6.45 5.29 9.45
Actual denitrification rate constant (d ) 0.30 0.40 1.06 5.15 1.36 1.12 0.82
-1
Distance to 90% reduction (km) 292 221 84 10.5 52 71 102
10/1/2013 6:47:13 PM
Soil and Water.indd 367 10/1/2013 6:47:13 PM
Soil and Water.indd 367