Page 366 - Soil and water contamination, 2nd edition
P. 366

Patterns in surface water                                             353
                                                     1000
                                                  a                                       6642

                                                     800
                                                    Concentration (mg/l)
                          b                          600
                                 THE
                             NETHERLANDS             400

                                IJssel
                                                     200
                         Nederrijn-Lek  Rees
                                  Rees
                           Waal
                                    Lippe
                                        GERMANY       0 0   2000  4000  6000  8000  10000  12000
                                        Ruhr                        Discharge (m 3 /s)
                                                                     Kalkofen      Rheinfelden
                         100 km          Sieg                        Rockenau      Maxau
                                                                     Hauconcourt
                                     Rhine
                                                                                   Worms
                                            Lahn                     Kleinheubach  Kaub
                                Andernach
                                           Kalkofen
                                Andernach  Kalkofen                  Schweinfurt   Andernach
                                                                                   Rees
                                                                     Cochem
                                 Cochem
                                 Cochem    Kaub   Schweinfurt
                                                  Schweinfurt
                                   Mosel         Main      V
                                                           Vierethiereth
                         LUXEMBURG
                                      Nahe        Kleinheubach
                                                  Kleinheubach
                                                Rockenau
                                        Worms   Rockenau
                                    Saar
                                                     Jagst
                                FRANCE     Rhine
                        Hauconcourt          Maxau  Kocher
                        Hauconcourt
                                                Neckar
                                                   Boden?
                                    Rheinfelden
                                    Rheinfelden    see
                                       Aare          AUSTRIA
                                   Lac de Neuchatel  Alpenrhine
                                    SWITZERLAND
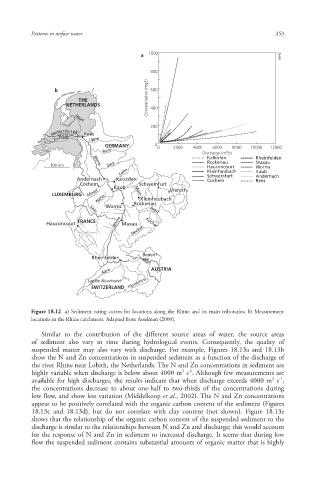
                   Figure 18.12  a) Sediment rating curves  for locations along the Rhine  and its main tributaries; b) Measurement
                   locations in the Rhine  catchment.  Adapted from Asselman (2000).
                      Similar to the contribution of the different source areas of water, the source areas
                   of sediment  also vary in time during hydrological events. Consequently, the quality of
                   suspended matter  may also vary with discharge. For example, Figures 18.13a and 18.13b
                   show the N and Zn  concentrations in suspended sediment  as a function of the discharge of
                   the river Rhine  near Lobith, the Netherlands. The N and Zn concentrations in sediment are
                                                              3
                                                                -1
                   highly variable when discharge is below about 4000 m  s . Although few measurements are
                                                                                          -1
                                                                                        3
                   available for high discharges, the results indicate that when discharge exceeds 4000 m  s ,
                   the concentrations decrease to about one-half to two-thirds of the concentrations during
                   low flow, and show less variation (Middelkoop et al., 2002). The N and Zn concentrations
                   appear to be positively correlated with the organic carbon content  of the sediment (Figures
                   18.13c and 18.13d), but do not correlate with clay content  (not shown). Figure 18.13e
                   shows that the relationship of the  organic carbon content of the suspended sediment to the
                   discharge is similar to the relationships between N and Zn and discharge; this would account
                   for the response of N and Zn in sediment to increased discharge. It seems that during low
                   flow the suspended sediment contains substantial amounts of organic matter  that is highly


                                                                                            10/1/2013   6:47:13 PM
        Soil and Water.indd   365
        Soil and Water.indd   365                                                           10/1/2013   6:47:13 PM
   361   362   363   364   365   366   367   368   369   370   371