
Page 370 - Soil and water contamination, 2nd edition
P. 370
Patterns in surface water 357
seasonality of in-stream nutrient concentrations is generally most apparent during baseflow
conditions, when the short-term effects of increased runoff are absent.
18.3.8 Long-term dynamics
In the long term, stream water quality reflects the trends in point and diffuse pollution
sources in the upstream catchment . Among the first and best known long-term monitoring
programmes to study linkages between water and nutrient fluxes and cycling in forests and
associated aquatic ecosystems, was the Hubbard Brook Ecosystem Study (HBES) (Likens
and Bormann, 1995). The Hubbard Brook Experimental Forest (HBEF ) is a 3160 ha
reserve located in the White Mountain National Forest, near Woodstock, New Hampshire,
USA, established in 1955 for hydrological research. The HBEF is operated and maintained
by the Northeastern Research Station, US Department of Agriculture, Newtown Square,
Pennsylania. In 1963, the actual HBES started to investigate trends in water and element
cycling in response to natural and human disturbance, such as climatic factors, landuse
changes, forest cutting, and air pollution. The ongoing monitoring programme has resulted
in one of the most extensive and longest continuous databases on the hydrology , biology ,
geology, and chemistry of natural ecosystems. The HBEF contains nine small, gauged
experimental subcatchments in which a series of controlled field experiments have been
performed, ranging from calcium or herbicide treatment to various extents of forest clear-
cutting. One subcatchment (‘Watershed 6’) was set aside as a biogeochemical reference
catchment, in which no treatment was applied. Since 1917, when the last logging operation
took place, the forest composed of about 80 to 90 percent hardwoods and 10 to 20
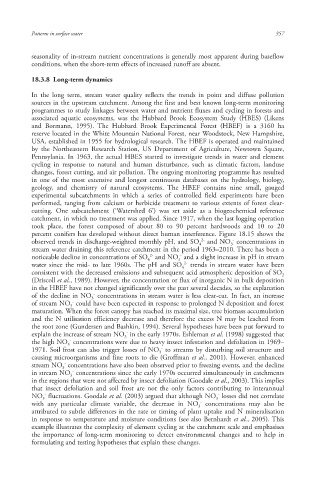
percent conifers has developed without direct human interference. Figure 18.15 shows the
-
2-
observed trends in discharge-weighted monthly pH , and SO and NO concentrations in
4 3
stream water draining this reference catchment in the period 1963–2010. There has been a
-
2-
noticeable decline in concentrations of SO and NO and a slight increase in pH in stream
4 3
2-
water since the mid- to late 1960s. The pH and SO trends in stream water have been
4
consistent with the decreased emissions and subsequent acid atmospheric deposition of SO
2
(Driscoll et al., 1989). However, the concentration or flux of inorganic N in bulk deposition
in the HBEF have not changed significantly over the past several decades, so the explanation
-
of the decline in NO concentrations in stream water is less clear-cut. In fact, an increase
3
-
of stream NO could have been expected in response to prolonged N deposition and forest
3
maturation. When the forest canopy has reached its maximal size, tree biomass accumulation
and the N utilisation efficiency decrease and therefore the excess N may be leached from
the root zone (Gundersen and Bashkin, 1994). Several hypotheses have been put forward to
-
explain the increase of stream NO in the early 1970s. Eshleman et al. (1998) suggested that
3
-
the high NO concentrations were due to heavy insect infestation and defoliation in 1969–
3
-
1971. Soil frost can also trigger losses of NO to streams by disturbing soil structure and
3
causing microorganisms and fine roots to die (Groffman et al., 2001). However, enhanced
-
stream NO concentrations have also been observed prior to freezing events, and the decline
3
-
in stream NO concentrations since the early 1970s occurred simultaneously in catchments
3
in the regions that were not affected by insect defoliation (Goodale et al., 2003). This implies
that insect defoliation and soil frost are not the only factors contributing to interannual
-
-
NO fluctuations. Goodale et al. (2003) argued that although NO losses did not correlate
3 3
-
with any particular climate variable, the decrease in NO concentrations may also be
3
attributed to subtle differences in the rate or timing of plant uptake and N mineralisation
in response to temperature and moisture conditions (see also Bernhardt et al., 2005). This
example illustrates the complexity of element cycling at the catchment scale and emphasises
the importance of long-term monitoring to detect environmental changes and to help in
formulating and testing hypotheses that explain these changes.
10/1/2013 6:47:17 PM
Soil and Water.indd 369 10/1/2013 6:47:17 PM
Soil and Water.indd 369