
Page 362 - Soil and water contamination, 2nd edition
P. 362
Patterns in surface water 349
a 1,2 4.0 b 3.6
3.5 3.4
1,0 3.0 3.2
Discharge (m 3 s -1 ) 0,8 2.5 -1 ) Cl (mg l Cl concentration (mg l -1 ) 3.0
2.8
0,6
2.0
2.6
1.5
0,4
1.0 2.4
0,2 2.2
0.5
2.0
0 0
26/3 27/3 28/3 29/3 30/3 31/3 1/4 2/4 3/4 4/4 0 0.2 0.4 0.6 0.8 1.0 1.2
6642 6642 6642 Discharge Cl concentration Old water Discharge (m 3 s -1 )
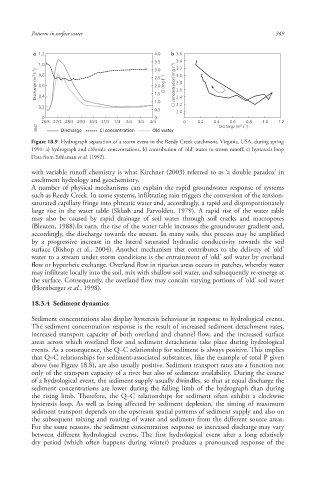
Figure 18.9 Hydrograph separation of a storm event in the Reedy Creek catchment, Virginia, USA, during spring
1991: a) hydrograph and chloride concentrations, b) contribution of ‘old’ water to storm runoff, c) hysteresis loop
Data from Eshleman et al. (1992).
with variable runoff chemistry is what Kirchner (2003) referred to as ‘a double paradox’ in
catchment hydrology and geochemistry.
A number of physical mechanisms can explain the rapid groundwater response of systems
such as Reedy Creek. In some systems, infiltrating rain triggers the conversion of the tension-
saturated capillary fringe into phreatic water and, accordingly, a rapid and disproportionately
large rise in the water table (Sklash and Farvolden, 1979). A rapid rise of the water table
may also be caused by rapid drainage of soil water through soil cracks and macropores
(Bleuten, 1988).In turn, the rise of the water table increases the groundwater gradient and,
accordingly, the discharge towards the stream. In many soils, this process may be amplified
by a progressive increase in the lateral saturated hydraulic conductivity towards the soil
surface (Bishop et al., 2004). Another mechanism that contributes to the delivery of ‘old’
water to a stream under storm conditions is the entrainment of ‘old’ soil water by overland
flow or hyporheic exchange. Overland flow in riparian areas occurs in patches, whereby water
may infiltrate locally into the soil, mix with shallow soil water, and subsequently re-emerge at
the surface. Consequently, the overland flow may contain varying portions of ‘old’ soil water
(Hornberger et al., 1998).
18.3.4 Sediment dynamics
Sediment concentrations also display hysteresis behaviour in response to hydrological events.
The sediment concentration response is the result of increased sediment detachment rates,
increased transport capacity of both overland and channel flow, and the increased surface
areas across which overland flow and sediment detachment take place during hydrological
events. As a consequence, the Q–C relationship for sediment is always positive. This implies
that Q–C relationships for sediment-associated substances, like the example of total P given
above (see Figure 18.8), are also usually positive. Sediment transport rates are a function not
only of the transport capacity of a river but also of sediment availability. During the course
of a hydrological event, the sediment supply usually dwindles, so that at equal discharge the
sediment concentrations are lower during the falling limb of the hydrograph than during
the rising limb. Therefore, the Q–C relationships for sediment often exhibit a clockwise
hysteresis loop. As well as being affected by sediment depletion, the timing of maximum
sediment transport depends on the upstream spatial patterns of sediment supply and also on
the subsequent mixing and routing of water and sediment from the different source areas.
For the same reasons, the sediment concentration response to increased discharge may vary
between different hydrological events. The first hydrological event after a long relatively
dry period (which often happens during winter) produces a pronounced response of the
10/1/2013 6:47:12 PM
Soil and Water.indd 361 10/1/2013 6:47:12 PM
Soil and Water.indd 361