
Page 167 - Solid Waste Analysis and Minimization a Systems Approach
P. 167
STEP 5: DATA ANALYSIS 145
Stream or Container #1
Adjust density assumptions Percent of Material Recycle Recycled Recycled Disposed Disposed
based on observations Waste Material Container Density Percent Volume Weight Volume Weight
Density Factors (lb/cy) or Stream lb/cy CY/yr tons/yr CY/yr tons/yr
Loose Stack Comp Baled Paper
200 350 500 700 Newsprint
60 200 350 650 Corrugated cardboard
60 350 500 700 Kraft paper
60 200 450 450 Waxed cardboard
Office Paper
300 450 650 750 Computer printout (CPO)
300 450 650 750 White ledger (WL)
250 450 650 750 Mix office pap (MOP)
300 400 600 650 Ground wood CPO
250 400 600 650 Cardstock/folders
200 350 600 600 Box(gray)board
300 550 650 700 Books
300 600 700 800 Magazines & glossy
150 400 550 650 Tissue paper
250 400 500 600 Other mixed paper
Loose Stack Comp Grnd Wood
200 300 700 500 Pallets
300 600 700 500 Lumber, etc.
700 500 Logs, etc.
Loose Stack Comp Compostables
400 1000 Yard waste**
150 200 400 Brush
300 600 Soiled paper
850 1200 Food waste
500 800 Other compostables
Loose Stack Baled Grnd Metals
150 1000 1600 2000 Ferrous scrap
50 400 500 400 Aluminum
150 16 2000 Other nonferrous **
Estimate by Conditions Plastics
15 100 PS foam
150 500 PS rigid
100 400 PE (nonfilm/nonfoam)
100 400 PP (nonfilm/nonfoam)
150 500 PVC (nonfilm/nonfoam)
20 300 Foams
25 1100 Film plastic
Other plastics
Loose Baled Textiles
200 400 Wool/cotton/linen
100 400 Synthetic fabrics/fibers
Bulk Other Materials
1200 Sludge
Miscellaneous
**density varies greatly
TOTAL
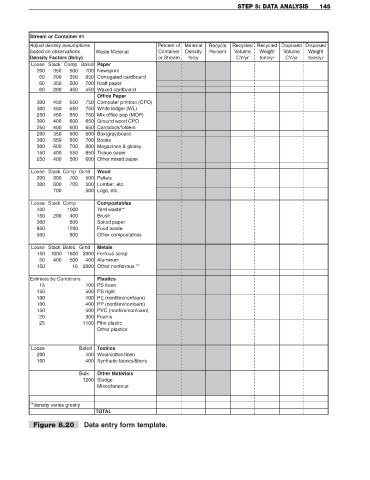
Figure 8.20 Data entry form template.