
Page 171 - Solid Waste Analysis and Minimization a Systems Approach
P. 171
STEP 6: IDENTIFY MAJOR WASTE MINIMIZATION OPPORTUNITIES 149
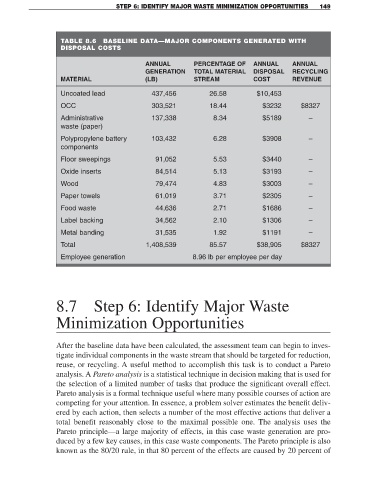
TABLE 8.6 BASELINE DATA—MAJOR COMPONENTS GENERATED WITH
DISPOSAL COSTS
ANNUAL PERCENTAGE OF ANNUAL ANNUAL
GENERATION TOTAL MATERIAL DISPOSAL RECYCLING
MATERIAL (LB) STREAM COST REVENUE
Uncoated lead 437,456 26.58 $10,453
OCC 303,521 18.44 $3232 $8327
Administrative 137,338 8.34 $5189 –
waste (paper)
Polypropylene battery 103,432 6.28 $3908 –
components
Floor sweepings 91,052 5.53 $3440 –
Oxide inserts 84,514 5.13 $3193 –
Wood 79,474 4.83 $3003 –
Paper towels 61,019 3.71 $2305 –
Food waste 44,636 2.71 $1686 –
Label backing 34,562 2.10 $1306 –
Metal banding 31,535 1.92 $1191 –
Total 1,408,539 85.57 $38,905 $8327
Employee generation 8.96 lb per employee per day
8.7 Step 6: Identify Major Waste
Minimization Opportunities
After the baseline data have been calculated, the assessment team can begin to inves-
tigate individual components in the waste stream that should be targeted for reduction,
reuse, or recycling. A useful method to accomplish this task is to conduct a Pareto
analysis. A Pareto analysis is a statistical technique in decision making that is used for
the selection of a limited number of tasks that produce the significant overall effect.
Pareto analysis is a formal technique useful where many possible courses of action are
competing for your attention. In essence, a problem solver estimates the benefit deliv-
ered by each action, then selects a number of the most effective actions that deliver a
total benefit reasonably close to the maximal possible one. The analysis uses the
Pareto principle—a large majority of effects, in this case waste generation are pro-
duced by a few key causes, in this case waste components. The Pareto principle is also
known as the 80/20 rule, in that 80 percent of the effects are caused by 20 percent of