
Page 168 - Solid Waste Analysis and Minimization a Systems Approach
P. 168
146 THE GENERAL APPROACH FOR A SOLID WASTE ASSESSMENT
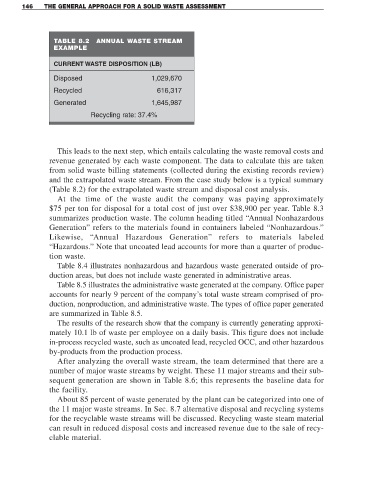
TABLE 8.2 ANNUAL WASTE STREAM
EXAMPLE
CURRENT WASTE DISPOSITION (LB)
Disposed 1,029,670
Recycled 616,317
Generated 1,645,987
Recycling rate: 37.4%
This leads to the next step, which entails calculating the waste removal costs and
revenue generated by each waste component. The data to calculate this are taken
from solid waste billing statements (collected during the existing records review)
and the extrapolated waste stream. From the case study below is a typical summary
(Table 8.2) for the extrapolated waste stream and disposal cost analysis.
At the time of the waste audit the company was paying approximately
$75 per ton for disposal for a total cost of just over $38,900 per year. Table 8.3
summarizes production waste. The column heading titled “Annual Nonhazardous
Generation” refers to the materials found in containers labeled “Nonhazardous.”
Likewise, “Annual Hazardous Generation” refers to materials labeled
“Hazardous.” Note that uncoated lead accounts for more than a quarter of produc-
tion waste.
Table 8.4 illustrates nonhazardous and hazardous waste generated outside of pro-
duction areas, but does not include waste generated in administrative areas.
Table 8.5 illustrates the administrative waste generated at the company. Office paper
accounts for nearly 9 percent of the company’s total waste stream comprised of pro-
duction, nonproduction, and administrative waste. The types of office paper generated
are summarized in Table 8.5.
The results of the research show that the company is currently generating approxi-
mately 10.1 lb of waste per employee on a daily basis. This figure does not include
in-process recycled waste, such as uncoated lead, recycled OCC, and other hazardous
by-products from the production process.
After analyzing the overall waste stream, the team determined that there are a
number of major waste streams by weight. These 11 major streams and their sub-
sequent generation are shown in Table 8.6; this represents the baseline data for
the facility.
About 85 percent of waste generated by the plant can be categorized into one of
the 11 major waste streams. In Sec. 8.7 alternative disposal and recycling systems
for the recyclable waste streams will be discussed. Recycling waste steam material
can result in reduced disposal costs and increased revenue due to the sale of recy-
clable material.