Page 172 - Solid Waste Analysis and Minimization a Systems Approach
P. 172

150     THE GENERAL APPROACH FOR A SOLID WASTE ASSESSMENT


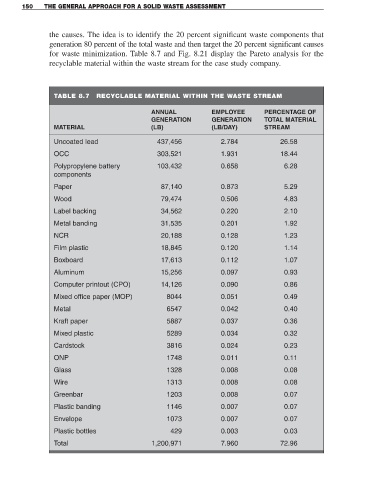
                 the causes. The idea is to identify the 20 percent significant waste components that
                 generation 80 percent of the total waste and then target the 20 percent significant causes
                 for waste minimization. Table 8.7 and Fig. 8.21 display the Pareto analysis for the
                 recyclable material within the waste stream for the case study company.


                   TABLE 8.7     RECYCLABLE MATERIAL WITHIN THE WASTE STREAM


                                                   ANNUAL              EMPLOYEE         PERCENTAGE OF
                                                   GENERATION          GENERATION       TOTAL MATERIAL
                   MATERIAL                        (LB)                (LB/DAY)         STREAM

                   Uncoated lead                     437,456              2.784               26.58
                   OCC                               303,521              1.931               18.44

                   Polypropylene battery             103,432              0.658                6.28
                   components

                   Paper                              87,140              0.873                5.29
                   Wood                               79,474              0.506                4.83

                   Label backing                      34,562              0.220                2.10

                   Metal banding                      31,535              0.201                1.92
                   NCR                                20,188              0.128                1.23
                   Film plastic                       18,845              0.120                1.14

                   Boxboard                           17,613              0.112                1.07

                   Aluminum                           15,256              0.097                0.93
                   Computer printout (CPO)            14,126              0.090                0.86

                   Mixed office paper (MOP)              8044              0.051                0.49
                   Metal                                6547              0.042                0.40

                   Kraft paper                          5887              0.037                0.36
                   Mixed plastic                        5289              0.034                0.32

                   Cardstock                            3816              0.024                0.23
                   ONP                                  1748              0.011                0.11

                   Glass                                1328              0.008                0.08
                   Wire                                 1313              0.008                0.08

                   Greenbar                             1203              0.008                0.07
                   Plastic banding                      1146              0.007                0.07

                   Envelope                             1073              0.007                0.07
                   Plastic bottles                       429              0.003                0.03

                   Total                           1,200,971              7.960               72.96
   167   168   169   170   171   172   173   174   175   176   177