
Page 169 - Solid Waste Analysis and Minimization a Systems Approach
P. 169
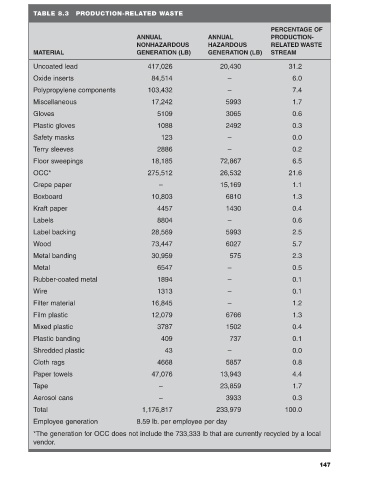
TABLE 8.3     PRODUCTION-RELATED WASTE


                                                                                           PERCENTAGE OF
                                              ANNUAL                  ANNUAL               PRODUCTION-
                                              NONHAZARDOUS            HAZARDOUS            RELATED WASTE
            MATERIAL                          GENERATION (LB)         GENERATION (LB)      STREAM

            Uncoated lead                         417,026                 20,430                31.2

            Oxide inserts                          84,514                   –                     6.0
            Polypropylene components              103,432                   –                     7.4
            Miscellaneous                          17,242                   5993                  1.7

            Gloves                                   5109                   3065                  0.6
            Plastic gloves                           1088                   2492                  0.3

            Safety masks                              123                   –                     0.0
            Terry sleeves                            2886                   –                     0.2

            Floor sweepings                        18,185                 72,867                  6.5
            OCC*                                  275,512                 26,532                21.6

            Crepe paper                               –                   15,169                  1.1
            Boxboard                               10,803                   6810                  1.3
            Kraft paper                              4457                   1430                  0.4

            Labels                                   8804                   –                     0.6
            Label backing                          28,569                   5993                  2.5

            Wood                                   73,447                   6027                  5.7
            Metal banding                          30,959                    575                  2.3

            Metal                                    6547                   –                     0.5
            Rubber-coated metal                      1894                   –                     0.1

            Wire                                     1313                   –                     0.1
            Filter material                        16,845                   –                     1.2
            Film plastic                           12,079                   6766                  1.3

            Mixed plastic                            3787                   1502                  0.4
            Plastic banding                           409                    737                  0.1

            Shredded plastic                            43                  –                     0.0
            Cloth rags                               4668                   5857                  0.8

            Paper towels                           47,076                 13,943                  4.4
            Tape                                      –                   23,859                  1.7

            Aerosol cans                              –                     3933                  0.3
            Total                               1,176,817                233,979               100.0
            Employee generation               8.59 lb. per employee per day

            *The generation for OCC does not include the 733,333 lb that are currently recycled by a local
            vendor.


                                                                                                           147