
Page 185 - Solid Waste Analysis and Minimization a Systems Approach
P. 185
STEP 7: DETERMINE, EVALUATE, AND SELECT WASTE MINIMIZATION ALTERNATIVES 163
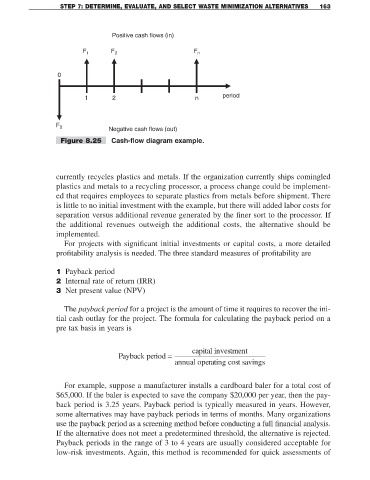
Positive cash flows (in)
F 1 F 2 F n
0
period
1 2 n
F 0
Negative cash flows (out)
Figure 8.25 Cash-flow diagram example.
currently recycles plastics and metals. If the organization currently ships comingled
plastics and metals to a recycling processor, a process change could be implement-
ed that requires employees to separate plastics from metals before shipment. There
is little to no initial investment with the example, but there will added labor costs for
separation versus additional revenue generated by the finer sort to the processor. If
the additional revenues outweigh the additional costs, the alternative should be
implemented.
For projects with significant initial investments or capital costs, a more detailed
profitability analysis is needed. The three standard measures of profitability are
1 Payback period
2 Internal rate of return (IRR)
3 Net present value (NPV)
The payback period for a project is the amount of time it requires to recover the ini-
tial cash outlay for the project. The formula for calculating the payback period on a
pre tax basis in years is
Payback period = capital investment
r
annual operating cost savings
For example, suppose a manufacturer installs a cardboard baler for a total cost of
$65,000. If the baler is expected to save the company $20,000 per year, then the pay-
back period is 3.25 years. Payback period is typically measured in years. However,
some alternatives may have payback periods in terms of months. Many organizations
use the payback period as a screening method before conducting a full financial analysis.
If the alternative does not meet a predetermined threshold, the alternative is rejected.
Payback periods in the range of 3 to 4 years are usually considered acceptable for
low-risk investments. Again, this method is recommended for quick assessments of