
Page 262 - Solid Waste Analysis and Minimization a Systems Approach
P. 262
240 SOLID WASTE CHARACTERIZATION BY BUSINESS ACTIVITIES
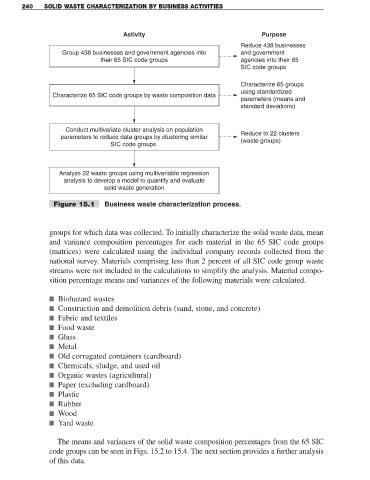
Activity Purpose
Reduce 438 businesses
Group 438 businesses and government agencies into and government
their 65 SIC code groups agencies into their 65
SIC code groups
Characterize 65 groups
using standardized
Characterize 65 SIC code groups by waste composition data
parameters (means and
standard deviations)
Conduct multivariate cluster analysis on population
Reduce to 22 clusters
parameters to reduce data groups by clustering similar
(waste groups)
SIC code groups
Analyze 22 waste groups using multivariable regression
analysis to develop a model to quantify and evaluate
solid waste generation
Figure 15.1 Business waste characterization process.
groups for which data was collected. To initially characterize the solid waste data, mean
and variance composition percentages for each material in the 65 SIC code groups
(matrices) were calculated using the individual company records collected from the
national survey. Materials comprising less than 2 percent of all SIC code group waste
streams were not included in the calculations to simplify the analysis. Material compo-
sition percentage means and variances of the following materials were calculated.
■ Biohazard wastes
■ Construction and demolition debris (sand, stone, and concrete)
■ Fabric and textiles
■ Food waste
■ Glass
■ Metal
■ Old corrugated containers (cardboard)
■ Chemicals, sludge, and used oil
■ Organic wastes (agricultural)
■ Paper (excluding cardboard)
■ Plastic
■ Rubber
■ Wood
■ Yard waste
The means and variances of the solid waste composition percentages from the 65 SIC
code groups can be seen in Figs. 15.2 to 15.4. The next section provides a further analysis
of this data.