
Page 265 - Solid Waste Analysis and Minimization a Systems Approach
P. 265
0.0 Rubber.var 0.0 0.0 0.0 2.2 1.9 0.0 0.0 0.0 0.0 0.0 0.0 0.0 0.0 0.0 0.0 0.0 0.0 0.0 0.0 0.0 0.0
0.0 Rubber.mean 0.0 0.0 0.0 8.0 7.0 0.0 0.0 0.0 0.0 0.0 0.0 0.0 0.0 0.0 0.0 0.0 0.0 0.0 0.0 0.0 0.0
0.6 Plastic.var 1.1 0.7 0.6 1.0 1.0 0.0 0.0 2.6 1.0 1.2 1.0 0.1 0.5 1.3 0.8 0.5 0.2 0.7 0.5 0.9 1.0
3.0 Plastic.mean 4.0 3.0 3.0 14.0 12.0 9.0 9.0 12.0 3.0 5.0 2.0 10.0 2.0 5.0 3.0 2.0 1.0 3.0 2.0 3.0 2.0
12.3 Paper.var 0.0 13.3 12.3 6.0 6.0 0.0 0.0 0.0 13.0 0.0 12.0 0.0 13.3 13.6 13.1 13.2 12.2 11.9 12.0 11.2 15.0
47.0 Paper.mean 36.0 46.0 47.0 26.0 27.0 27.0 27.0 36.0 45.0 32.0 46.0 26.0 46.0 47.0 46.0 47.0 48.0 49.0 48.0 46.0 47.0
0.0 Organic.var 0.0 0.0 0.0 0.0 0.0 0.0 0.0 0.0 0.0 0.0 0.0 0.0 0.0 0.0 0.0 0.0 0.0 0.0 0.0 0.0 0.0
0.0 Organic.mean 0.0 0.0 0.0 0.0 0.0 0.0 0.0 0.0 0.0 0.0 0.0 0.0 0.0 0.0 0.0 0.0 0.0 0.0 0.0 0.0 0.0
0.0 OilChem.var 0.4 0.0 0.0 1.6 1.3 0.0 0.0 0.0 0.0 0.0 0.0 0.0 0.0 0.0 0.0 0.0 0.0 0.0 0.0 0.0 0.0
0.0 OilChem.mean 1.0 0.0 0.0 8.0 8.0 0.0 0.0 0.0 0.0 0.0 0.0 0.0 0.0 0.0 0.0 0.0 0.0 0.0 0.0 0.0 0.0
1.9 OCC.var 1.4 1.9 1.9 2.9 2.9 1.0 1.2 1.0 1.9 1.4 1.7 1.0 1.7 1.9 1.7 1.9 1.9 1.7 1.9 1.7 1.9
8.0 OCC.mean 6.0 8.0 8.0 12.0 12.0 4.0 5.0 4.0 8.0 6.0 7.0 4.0 7.0 8.0 7.0 8.0 8.0 7.0 8.0 7.0 8.0
0.4 Metal.var 0.5 1.0 0.4 1.0 1.0 0.1 0.1 0.6 1.0 1.0 1.0 0.1 0.5 1.1 0.5 0.5 0.5 0.2 0.2 0.6 2.0
2.0 Metal.mean 2.0 2.0 2.0 15.0 13.0 4.0 4.0 3.0 2.0 3.0 1.0 4.0 2.0 4.0 2.0 2.0 2.0 1.0 1.0 2.0 2.0
0.6 Glass.var 2.2 0.6 0.6 0.6 0.6 0.8 0.8 0.6 0.6 0.6 0.6 0.8 0.6 0.6 0.3 0.6 0.6 0.6 0.6 0.6 0.6
2.0 Glass.mean 8.0 2.0 2.0 2.0 2.0 3.0 3.0 2.0 2.0 2.0 2.0 3.0 2.0 2.0 1.0 2.0 2.0 2.0 2.0 2.0 2.0
4.5 Food.var 0.0 4.7 4.5 1.0 1.0 0.0 0.0 0.0 3.7 0.0 4.5 0.0 5.0 4.7 4.6 4.8 4.4 3.9 4.0 3.9 5.1
16.0 Food.mean 29.0 15.0 16.0 7.0 6.0 38.0 37.0 14.0 15.0 33.0 16.0 38.0 16.0 15.0 15.0 16.0 16.0 15.0 15.0 15.0 15.0
0.0 Fabric.var 0.6 0.0 0.0 0.3 0.3 0.0 0.0 0.6 0.0 0.0 0.0 0.0 0.0 0.0 0.0 0.0 0.0 0.0 0.0 0.0 0.0
0.0 Fabric.mean 2.0 0.0 0.0 1.0 1.0 0.0 0.0 2.0 0.0 0.0 0.0 0.0 0.0 0.0 0.0 0.0 0.0 0.0 0.0 0.0 0.0
0.0 CandD.var 0.0 0.0 0.0 0.0 0.0 0.0 0.0 0.0 0.0 0.0 0.0 0.0 0.0 0.0 0.0 0.0 0.0 0.0 0.0 0.0 0.0
0.0 CandD.mean 0.0 0.0 0.0 0.0 0.0 0.0 0.0 0.0 0.0 0.0 0.0 0.0 0.0 0.0 0.0 0.0 0.0 0.0 0.0 0.0 0.0
0.0 BioHaz.var 0.0 0.0 0.0 0.0 0.0 0.0 0.0 4.3 0.0 0.0 0.0 0.0 0.0 0.0 0.0 0.0 0.0 0.0 0.0 0.0 0.0
0.0 BioHaz.mean 0.0 0.0 0.0 0.0 0.0 0.0 0.0 22.0 0.0 0.0 0.0 0.0 0.0 0.0 0.0 0.0 0.0 0.0 0.0 0.0 0.0
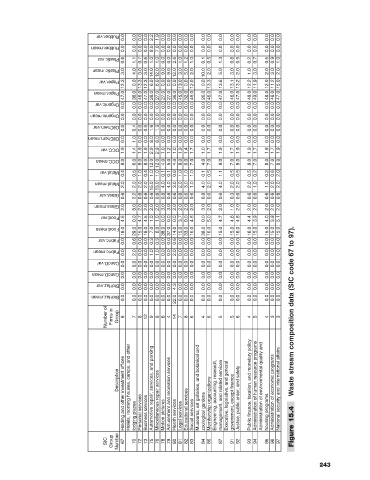
Number of Firms in Group 6 7 8 12 9 8 6 4 14 7 8 6 4 6 5 5 6 4 5 4 3 3 Waste stream composition data (SIC code 67 to 97).
Holding and other investment offices lodging places Personal services Business services Automotive repair, services, and parking Miscellaneous repair services Motion pictures Amusement and recreation services Health services Legal services Educational services Social services Museums, art galleries, and botanical and zoological gardens Membership organizations Engineering, accounting, research, management, and related services Execu
Description Hotels, rooming houses, camps, and other Public finance, taxation, and monetary policy Administration of human resource programs Administration of environmental quality and
SIC Group Number 67 70 72 73 75 76 78 79 80 81 82 83 84 86 87 91 92 93 94 95 96 97 Figure 15.4
243