
Page 264 - Solid Waste Analysis and Minimization a Systems Approach
P. 264
0.0 0.0 0.4 0.0 0.0 0.8 0.0 0.0 0.0 0.0 0.0 2.0 0.0 0.0 0.0 0.0 0.0 0.0 0.0 0.0 0.0 0.0
Rubber.var
0.0 0.0 1.3 0.0 0.0 3.0 0.0 0.0 0.0 0.0 0.0 7.0 0.0 0.0 0.0 0.0 0.0 0.0 0.0 0.0 0.0 0.0
Rubber.mean
6.2 6.4 4.7 5.7 6.5 1.6 2.6 1.9 3.2 2.7 2.7 1.0 2.4 2.6 1.0 1.7 0.6 0.6 0.8 0.9 0.9 0.9
Plastic.var
21.0 22.0 17.0 21.0 20.0 7.0 11.0 10.0 9.0 9.0 12.0 12.0 8.0 9.0 6.0 7.0 3.0 3.0 3.0 3.0 3.0 3.0
Plastic.mean
6.9 8.9 5.6 8.7 8.1 12.9 8.0 8.0 5.3 10.2 6.7 6.2 7.5 8.6 3.8 7.7 12.3 10.2 9.3 13.9 14.0 15.3
Paper.var
29.0 28.0 18.0 29.0 28.0 37.0 33.0 31.0 26.0 27.0 21.0 26.0 28.0 27.0 12.0 27.0 47.0 44.0 46.0 48.0 44.0 46.0
Paper.mean
0.0 0.0 0.0 0.0 0.0 0.0 0.0 0.0 0.0 0.0 0.0 0.0 0.0 0.0 0.0 0.0 0.0 0.0 0.0 0.0 0.0 0.0
Organic.var
0.0 0.0 0.0 0.0 0.0 0.0 0.0 0.0 0.0 0.0 0.0 0.0 0.0 0.0 0.0 0.0 0.0 0.0 0.0 0.0 0.0 0.0
Organic.mean
0.0 0.0 1.0 0.0 0.0 1.8 0.0 0.0 0.0 0.0 0.0 2.7 0.0 0.0 0.0 0.0 0.0 0.0 0.0 0.0 0.0 0.0
OilChem.var
0.0 0.0 2.0 0.0 0.0 5.0 0.0 0.0 0.0 0.0 0.0 9.0 0.0 0.0 0.0 0.0 0.0 0.0 0.0 0.0 0.0 0.0
OilChem.mean
1.7 1.9 2.4 1.7 1.4 1.0 2.6 3.1 2.9 2.6 1.9 2.9 2.9 3.1 3.0 3.4 1.9 1.4 1.9 1.7 1.7 1.9
OCC.var
7.0 8.0 10.0 7.0 6.0 9.0 11.0 13.0 12.0 11.0 8.0 12.0 12.0 13.0 10.0 14.0 8.0 6.0 8.0 7.0 7.0 8.0
OCC.mean
4.5 3.8 3.1 3.8 4.9 1.0 1.7 1.3 2.5 1.8 2.0 1.0 1.5 2.0 0.5 1.5 0.4 1.0 0.5 0.6 1.0 0.6
Metal.var
15.0 13.0 11.0 14.0 15.0 8.0 7.0 7.0 7.0 6.0 5.0 15.0 5.0 7.0 2.0 6.0 2.0 2.0 2.0 2.0 1.0 2.0
Metal.mean
1.1 1.4 0.6 1.4 1.1 0.3 0.6 0.6 0.8 0.6 0.6 0.6 0.8 0.6 1.5 0.6 0.6 0.6 0.6 0.6 0.6 0.6
Glass.var
4.0 5.0 2.0 5.0 4.0 1.0 2.0 2.0 3.0 2.0 2.0 2.0 3.0 2.0 3.0 2.0 2.0 2.0 2.0 2.0 2.0 2.0
Glass.mean
1.3 1.4 2.7 1.3 1.6 1.0 2.1 2.8 1.5 2.4 4.0 1.0 2.0 2.0 7.0 1.5 4.5 3.7 3.0 5.0 5.8 5.7
Food.var
5.0 4.0 8.0 4.0 5.0 4.0 8.0 10.0 7.0 6.0 38.0 7.0 7.0 6.0 61.0 5.0 16.0 15.0 14.0 16.0 17.0 16.0
Food.mean
0.0 0.0 2.0 0.0 0.0 0.3 1.1 0.8 0.8 0.6 0.0 0.3 0.8 1.1 0.0 0.6 0.0 0.0 0.0 0.0 0.0 0.0
Fabric.var
0.0 0.0 2.0 0.0 0.0 1.0 4.0 3.0 3.0 2.0 0.0 1.0 3.0 4.0 0.0 2.0 0.0 0.0 0.0 0.0 0.0 0.0
Fabric.mean
0.0 0.0 0.0 0.0 0.0 0.0 0.0 0.0 0.0 0.0 0.0 0.0 0.0 0.0 0.0 0.0 0.0 0.0 0.0 0.0 0.0 0.0
CandD.var
0.0 0.0 0.0 0.0 0.0 0.0 0.0 0.0 0.0 0.0 0.0 0.0 0.0 0.0 0.0 0.0 0.0 0.0 0.0 0.0 0.0 0.0
CandD.mean
0.0 0.0 0.0 0.0 0.0 0.0 0.0 0.0 0.0 0.0 0.0 0.0 0.0 0.0 0.0 0.0 0.0 0.0 0.0 0.0 0.0 0.0
BioHaz.var
0.0 0.0 0.0 0.0 0.0 0.0 0.0 0.0 0.0 0.0 0.0 0.0 0.0 0.0 0.0 0.0 0.0 0.0 0.0 0.0 0.0 0.0
BioHaz.mean
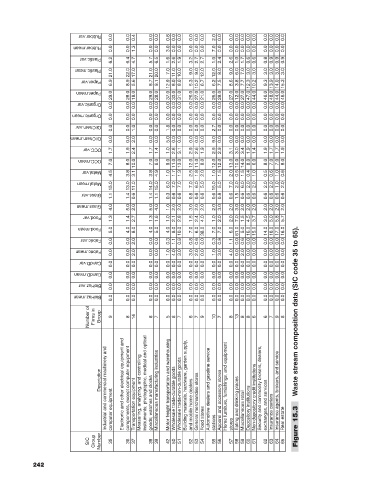
Number of Firms in Group 9 8 14 8 7 5 8 7 8 7 9 10 7 8 13 8 8 6 6 7 9 8 Waste stream composition data (SIC code 35 to 65).
Industrial and commercial machinery and computer equipment components, except computer equipment Transportation equipment Measuring, analyzing, and controlling goods; watches and clocks Miscellaneous manufacturing industries Wholesale trade-durable goods Wholesale trade-non-durable goods Building materials, hardware, garden supply, and mobile home dealers General merchandise stores Automotive dealers and gasoline service Apparel and access
Description Electronic and other electrical equipment and instruments; photographic, medical and optical Motor freight transportation and warehousing
SIC Group Number 35 36 37 38 39 42 50 51 52 53 Food stores 54 stations 55 56 stores 57 58 59 60 61 62 63 64 Real estate 65 Figure 15.3
242