
Page 263 - Solid Waste Analysis and Minimization a Systems Approach
P. 263
0.0 Rubber.var 0.0 0.0 0.0 0.0 0.0 0.0 0.0 0.0 0.0 0.0 0.0 0.0 0.0 0.0 0.0 0.0 0.0 0.0 0.0 0.0
0.0 Rubber.mean 0.0 0.0 0.0 0.0 0.0 0.0 0.0 0.0 0.0 0.0 0.0 0.0 0.0 0.0 0.0 0.0 0.0 0.0 0.0 0.0
2.1 Plastic.var 2.3 2.1 2.1 0.9 1.1 3.9 3.2 3.2 6.4 6.2 4.3 1.2 1.6 1.5 1.8 3.5 3.7 2.9 2.0 1.8
7.0 Plastic.mean 10.0 8.0 6.0 4.0 5.0 13.0 10.0 9.0 17.0 19.0 19.0 5.0 6.0 5.0 6.0 14.0 15.0 13.0 9.0 8.0
2.1 Paper.var 2.6 2.2 4.0 6.0 4.1 3.3 3.8 4.5 9.8 5.3 4.9 3.4 4.0 18.5 16.0 6.1 4.8 5.3 1.9 2.2
9.0 Paper.mean Organic.var Organic.mean 5.1 22.0 8.0 6.1 21.0 9.0 8.2 20.0 14.0 2.1 6.0 16.0 0.0 0.0 17.0 0.0 0.0 14.0 0.0 0.0 12.0 0.0 0.0 13.0 0.0 0.0 26.0 1.2 5.0 13.0 0.0 0.0 14.0 0.0 0.0 14.0 3.1 11.0 15.0 2.7 11.0 65.0 0.0 0.0 51.0 0.0 0.0 19.0 0.0 0.0 18.0 0.0 0.0 20.0 0.0 0.0 8.0 0.0 0.0 9.0 0.0 0.0
Mean Waste Stream Compostition Percentage OilChem.var OilChem.mean OCC.var OCC.mean 0.0 0.0 2.3 9.0 0.0 0.0 2.2 9.0 0.0 0.0 2.2 9.0 0.0 0.0 1.9 8.0 1.2 3.0 1.9 8.0 0.8 3.0 1.9 8.0 0.0 0.0 1.2 5.0 0.0 0.0 1.4 6.0 0.0 0.0 1.2 5.0 0.0 0.0 1.4 6.0 0.0 0.0 2.4 10.0 0.0 0.0 2.6 11.0 0.0 0.0 1.4 6.0 0.0 0.0 1.7 7.0 0.0 0.0 2.6 11.0 0.0 0.0 3.1 13.0 5.0 20.0 1.7 7.0 6.1 18.0 1.9 8.0 4.
0.3 Metal.var Metal.mean Glass.var 2.7 9.0 2.3 10.0 0.3 2.4 9.0 0.3 3.2 9.0 0.0 2.9 13.0 0.6 2.2 10.0 0.6 3.0 10.0 1.1 3.9 12.0 0.8 3.9 11.0 1.1 1.5 4.0 0.3 2.3 7.0 0.0 1.6 7.0 0.0 3.2 13.0 0.6 2.9 11.0 0.6 0.9 3.0 0.0 0.9 3.0 0.0 1.7 7.0 0.6 1.5 6.0 0.6 1.6 7.0 0.6 13.8 61.0 0.0 13.1 59.0 0.0
1.0 Glass.mean 1.0 1.0 0.0 2.0 2.0 4.0 3.0 4.0 1.0 0.0 0.0 2.0 2.0 0.0 0.0 2.0 2.0 2.0 0.0 0.0
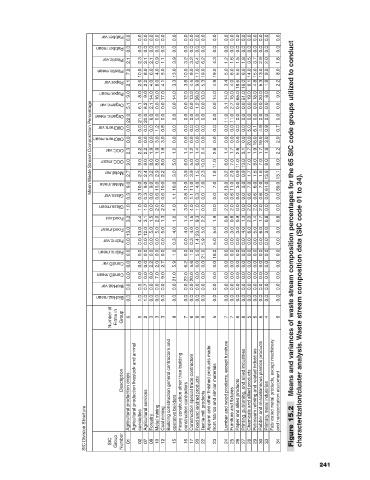
3.2 4.4 3.1 1.5 2.0 1.3 1.0 1.4 1.5 9.3 2.2 1.9 0.8 0.8 0.9 1.3 2.0 1.4 1.7 0.8 0.8 Means and variances of waste stream composition percentages for the 65 SIC code groups utilized to conduct
Food.var
13.0 13.0 12.0 5.0 5.0 5.0 4.0 4.0 4.0 23.0 5.0 5.0 3.0 3.0 3.0 4.0 6.0 5.0 6.0 3.0 3.0
Food.mean
0.0 0.0 0.0 0.0 0.0 0.0 0.3 0.0 0.3 1.4 5.9 5.0 0.0 0.0 0.0 0.0 0.0 0.0 0.0 0.0 0.0
Fabric.var
0.0 0.0 0.0 0.0 0.0 0.0 1.0 0.0 1.0 5.0 21.0 18.0 0.0 0.0 0.0 0.0 0.0 0.0 0.0 0.0 0.0
Fabric.mean
0.0 0.0 0.0 2.2 2.0 2.7 5.9 6.2 5.6 0.0 0.0 0.0 0.0 0.0 0.0 0.0 0.0 0.0 0.0 0.0 0.0
CandD.var
0.0 0.0 0.0 8.0 7.0 9.0 21.0 22.0 20.0 0.0 0.0 0.0 0.0 0.0 0.0 0.0 0.0 0.0 0.0 0.0 0.0
CandD.mean
0.0 0.5 0.7 0.0 0.0 0.0 0.0 0.0 0.0 0.0 0.0 0.0 0.0 0.0 0.0 0.0 0.0 0.0 0.0 0.0 0.0
BioHaz.var
0.0 1.0 1.0 0.0 0.0 0.0 0.0 0.0 0.0 0.0 0.0 0.0 0.0 0.0 0.0 0.0 0.0 0.0 0.0 0.0 0.0
BioHaz.mean
Number of Firms in Group 6 5 2 3 3 3 8 7 6 8 8 5 7 7 6 8 5 6 5 4 6 characterization/cluster analysis. Waste stream composition data (SIC code 01 to 34).
Description Agricultural production crops Agricultural production livestock and animal Building construction general contractors and Heavy construction other than building Construction special trade contractors Food and kindred products Apparel and other finished products made from fabrics and similar materials Lumber and wood products, except furniture Printing, publishing, and allied industries Chemicals and allied products Pet
SIC Division Structure SIC Group Number 01 specialties 02 Agricultural services 07 Forestry 08 Metal mining 10 Coal mining 12 operative builders 15 construction contractors 16 17 20 Textile mill products 22 23 24 Furniture and fixtures 25 Paper and allied products 26 27 28 29 30 Primary metal industries 33 34 Figure 15.2
241