
Page 267 - Solid Waste Analysis and Minimization a Systems Approach
P. 267
SIC CODE GROUPING VALIDATION 245
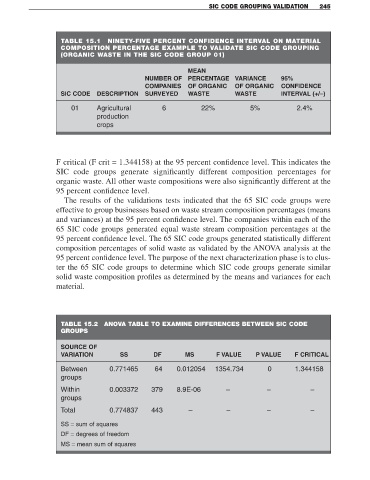
TABLE 15.1 NINETY-FIVE PERCENT CONFIDENCE INTERVAL ON MATERIAL
COMPOSITION PERCENTAGE EXAMPLE TO VALIDATE SIC CODE GROUPING
(ORGANIC WASTE IN THE SIC CODE GROUP 01)
MEAN
NUMBER OF PERCENTAGE VARIANCE 95%
COMPANIES OF ORGANIC OF ORGANIC CONFIDENCE
SIC CODE DESCRIPTION SURVEYED WASTE WASTE INTERVAL (+/–)
01 Agricultural 6 22% 5% 2.4%
production
crops
F critical (F crit = 1.344158) at the 95 percent confidence level. This indicates the
SIC code groups generate significantly different composition percentages for
organic waste. All other waste compositions were also significantly different at the
95 percent confidence level.
The results of the validations tests indicated that the 65 SIC code groups were
effective to group businesses based on waste stream composition percentages (means
and variances) at the 95 percent confidence level. The companies within each of the
65 SIC code groups generated equal waste stream composition percentages at the
95 percent confidence level. The 65 SIC code groups generated statistically different
composition percentages of solid waste as validated by the ANOVA analysis at the
95 percent confidence level. The purpose of the next characterization phase is to clus-
ter the 65 SIC code groups to determine which SIC code groups generate similar
solid waste composition profiles as determined by the means and variances for each
material.
TABLE 15.2 ANOVA TABLE TO EXAMINE DIFFERENCES BETWEEN SIC CODE
GROUPS
SOURCE OF
VARIATION SS DF MS F VALUE P VALUE F CRITICAL
Between 0.771465 64 0.012054 1354.734 0 1.344158
groups
Within 0.003372 379 8.9E-06 – – –
groups
Total 0.774837 443 – – – –
SS = sum of squares
DF = degrees of freedom
MS = mean sum of squares