
Page 272 - Solid Waste Analysis and Minimization a Systems Approach
P. 272
250 SOLID WASTE CHARACTERIZATION BY BUSINESS ACTIVITIES
where
k = SIC code groups number
n = number of attributes for the SIC code groups
y = the matrix value for attribute i and SIC code group k
ij
y.. = mean of all standardized attributes
y . = mean of standardized attributes for SIC code group k
i
It is similar to doing a one-way analysis of variance where the groups are unknown and
the largest F value is sought by reassigning members to each group (Norusis, 1986).
The k-means method starts with one cluster and splits it into two clusters by picking the
case farthest from the center as a seed for a second cluster and assigning each case to
the nearest center. It continues splitting one of the clusters into two (and reassigning
cases) until a specified number of clusters are formed. The k-means method reassigns
cases until the within-groups sum of squares can no longer be reduced (Norusis, 1986).
The k-means method was made possible by the high speed of computer processing
available. The k-means method is a rigorous procedure that evaluates all permutations
to minimize SSE and maximize SSA. The software program SYSTAT, developed by
SPSS, Inc. was used to perform the multivariate cluster analysis.
The drawback of this method is determining the number of clusters to use (k). This was
handled by applying a variance analysis technique (Everitt, 1980). Thorndike plotted
average within cluster distance (SSA/k) against the number of groups (k). With every
increase in k, there will be a decrease in this measurement, but Thorndike suggested that
a sudden marked flattening of the curve at any point indicated a distinctive, correct value
for k (Everitt, 1980). Such a point should occur when the number of groups corresponds
to the configuration of points and there is relatively little gain from further increase in k.
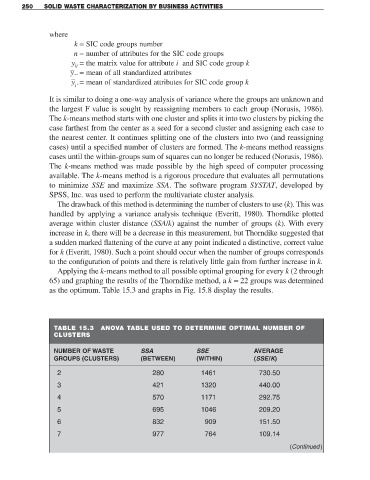
Applying the k-means method to all possible optimal grouping for every k (2 through
65) and graphing the results of the Thorndike method, a k = 22 groups was determined
as the optimum. Table 15.3 and graphs in Fig. 15.8 display the results.
TABLE 15.3 ANOVA TABLE USED TO DETERMINE OPTIMAL NUMBER OF
CLUSTERS
NUMBER OF WASTE SSA SSE AVERAGE
GROUPS (CLUSTERS) (BETWEEN) (WITHIN) (SSE/K)
2 280 1461 730.50
3 421 1320 440.00
4 570 1171 292.75
5 695 1046 209.20
6 832 909 151.50
7 977 764 109.14
(Continued )