
Page 276 - Solid Waste Analysis and Minimization a Systems Approach
P. 276
254 SOLID WASTE CHARACTERIZATION BY BUSINESS ACTIVITIES
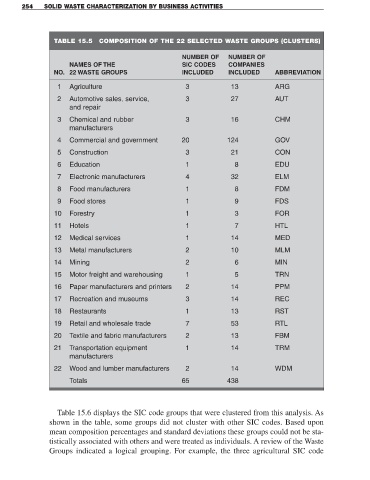
TABLE 15.5 COMPOSITION OF THE 22 SELECTED WASTE GROUPS (CLUSTERS)
NUMBER OF NUMBER OF
NAMES OF THE SIC CODES COMPANIES
NO. 22 WASTE GROUPS INCLUDED INCLUDED ABBREVIATION
1 Agriculture 3 13 ARG
2 Automotive sales, service, 3 27 AUT
and repair
3 Chemical and rubber 3 16 CHM
manufacturers
4 Commercial and government 20 124 GOV
5 Construction 3 21 CON
6 Education 1 8 EDU
7 Electronic manufacturers 4 32 ELM
8 Food manufacturers 1 8 FDM
9 Food stores 1 9 FDS
10 Forestry 1 3 FOR
11 Hotels 1 7 HTL
12 Medical services 1 14 MED
13 Metal manufacturers 2 10 MLM
14 Mining 2 6 MIN
15 Motor freight and warehousing 1 5 TRN
16 Paper manufacturers and printers 2 14 PPM
17 Recreation and museums 3 14 REC
18 Restaurants 1 13 RST
19 Retail and wholesale trade 7 53 RTL
20 Textile and fabric manufacturers 2 13 FBM
21 Transportation equipment 1 14 TRM
manufacturers
22 Wood and lumber manufacturers 2 14 WDM
Totals 65 438
Table 15.6 displays the SIC code groups that were clustered from this analysis. As
shown in the table, some groups did not cluster with other SIC codes. Based upon
mean composition percentages and standard deviations these groups could not be sta-
tistically associated with others and were treated as individuals. A review of the Waste
Groups indicated a logical grouping. For example, the three agricultural SIC code