
Page 280 - Solid Waste Analysis and Minimization a Systems Approach
P. 280
258 SOLID WASTE CHARACTERIZATION BY BUSINESS ACTIVITIES
TABLE 15.6 SIC CODE GROUPS THAT COMPRISE THE 22 SELECTED WASTE
GROUPS (CLUSTERS) (CONTINUED)
WASTE SIC
GROUP NAME GROUP NUMBER OF
NO. (CLUSTERS) NUMBER DESCRIPTION COMPANIES
18 Restaurants 58 Eating and drinking places 13
19 Retail and 50 Wholesale Trade-durable 8
wholesale trade Goods
(RTL)
51 Wholesale trade-non-durable 7
goods
52 Building materials, hardware, 8
garden supply, and mobile
home dealers
53 General merchandise stores 7
56 Apparel and accessory stores 7
57 Home furniture, furnishings, 8
and equipment stores
59 Miscellaneous retail 8
20 Textile and fabric 22 Textile mill products 8
manufacturers
(FBM)
23 Apparel and other finished 5
products made from fabrics and
similar materials
21 Transportation 37 Transportation equipment 14
equipment
manufacturers
(TRM)
22 Wood and lumber 24 Lumber and wood products, 7
manufacturers except furniture
(WDM)
25 Furniture and fixtures 7
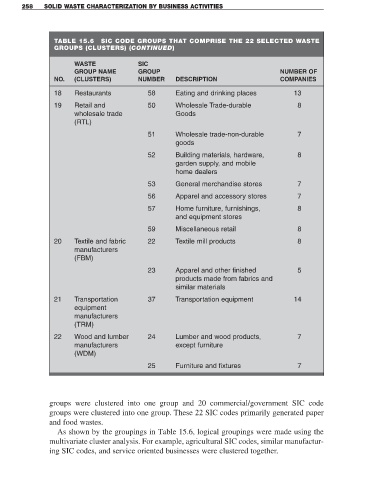
groups were clustered into one group and 20 commercial/government SIC code
groups were clustered into one group. These 22 SIC codes primarily generated paper
and food wastes.
As shown by the groupings in Table 15.6, logical groupings were made using the
multivariate cluster analysis. For example, agricultural SIC codes, similar manufactur-
ing SIC codes, and service oriented businesses were clustered together.